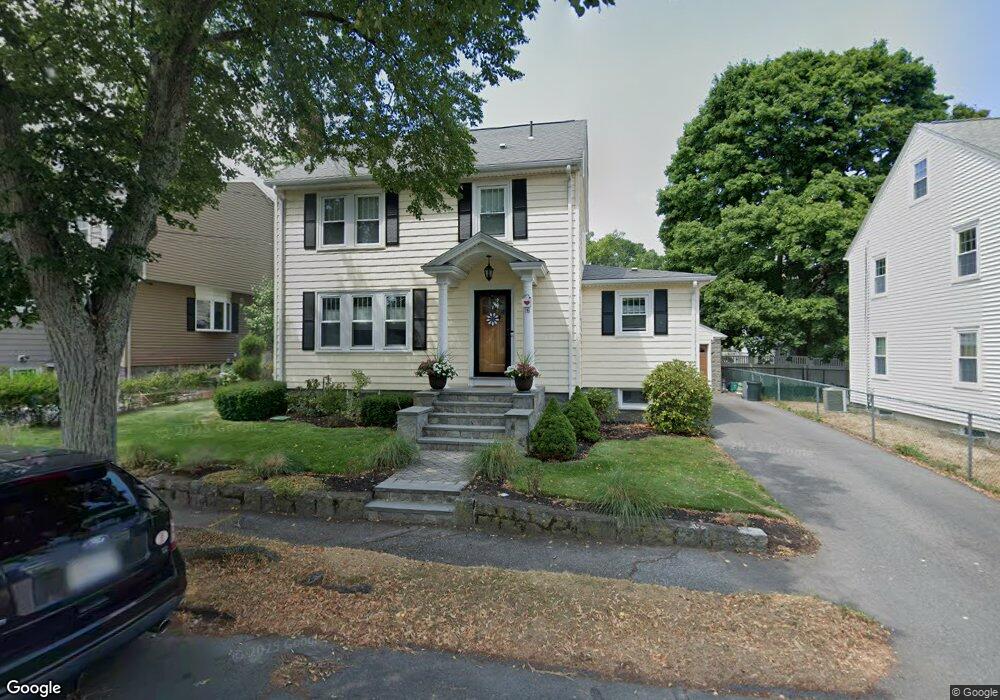
18 Melbourne Rd Milton, MA 02186
Estimated Value: $768,396 - $901,000
3
Beds
2
Baths
1,584
Sq Ft
$533/Sq Ft
Est. Value
About This Home
This home is located at 18 Melbourne Rd, Milton, MA 02186 and is currently estimated at $843,599, approximately $532 per square foot. 18 Melbourne Rd is a home located in Norfolk County with nearby schools including Milton High School, St. Agatha School, and Quincy Catholic Academy.
Ownership History
Date
Name
Owned For
Owner Type
Purchase Details
Closed on
Feb 24, 1995
Sold by
Debruyn Nancy H
Bought by
Lyons Corrine M and Lyons Timothy P
Current Estimated Value
Home Financials for this Owner
Home Financials are based on the most recent Mortgage that was taken out on this home.
Original Mortgage
$130,000
Interest Rate
9.17%
Mortgage Type
Purchase Money Mortgage
Create a Home Valuation Report for This Property
The Home Valuation Report is an in-depth analysis detailing your home's value as well as a comparison with similar homes in the area
Purchase History
| Date | Buyer | Sale Price | Title Company |
|---|---|---|---|
| Lyons Corrine M | $178,500 | -- |
Source: Public Records
Mortgage History
| Date | Status | Borrower | Loan Amount |
|---|---|---|---|
| Open | Lyons Corrine M | $200,000 | |
| Closed | Lyons Corrine M | $130,000 | |
| Closed | Lyons Corrine M | $130,000 |
Source: Public Records
Tax History
| Year | Tax Paid | Tax Assessment Tax Assessment Total Assessment is a certain percentage of the fair market value that is determined by local assessors to be the total taxable value of land and additions on the property. | Land | Improvement |
|---|---|---|---|---|
| 2025 | $8,565 | $772,300 | $439,900 | $332,400 |
| 2024 | $8,278 | $758,100 | $419,000 | $339,100 |
| 2023 | $7,830 | $686,800 | $372,700 | $314,100 |
| 2022 | $7,695 | $617,100 | $372,700 | $244,400 |
| 2021 | $7,253 | $552,400 | $319,700 | $232,700 |
| 2020 | $7,090 | $540,400 | $312,000 | $228,400 |
| 2019 | $6,914 | $524,600 | $302,900 | $221,700 |
| 2018 | $6,612 | $478,800 | $260,600 | $218,200 |
| 2017 | $6,186 | $456,200 | $248,200 | $208,000 |
| 2016 | $6,099 | $451,800 | $248,200 | $203,600 |
| 2015 | $6,129 | $439,700 | $240,300 | $199,400 |
Source: Public Records
Map
Nearby Homes
- 0 Franklin St
- 30 Elmwood Park
- 281 Elmwood Ave
- 17 Albany St
- 440 Granite Ave Unit 201
- 400 Adams St Unit A
- 397 Adams St
- 154 N Central Ave
- 41 Wallace Rd
- 1185 Brook Rd
- 21 Robertson St
- 98 Safford St
- 54 Safford St
- 115 W Squantum St Unit 517
- 115 W Squantum St Unit 203
- 115 W Squantum St Unit 811
- 107 Fayette St
- 100 W Squantum St Unit 411
- 267-269 Farrington St
- 46 Century Ln
Your Personal Tour Guide
Ask me questions while you tour the home.