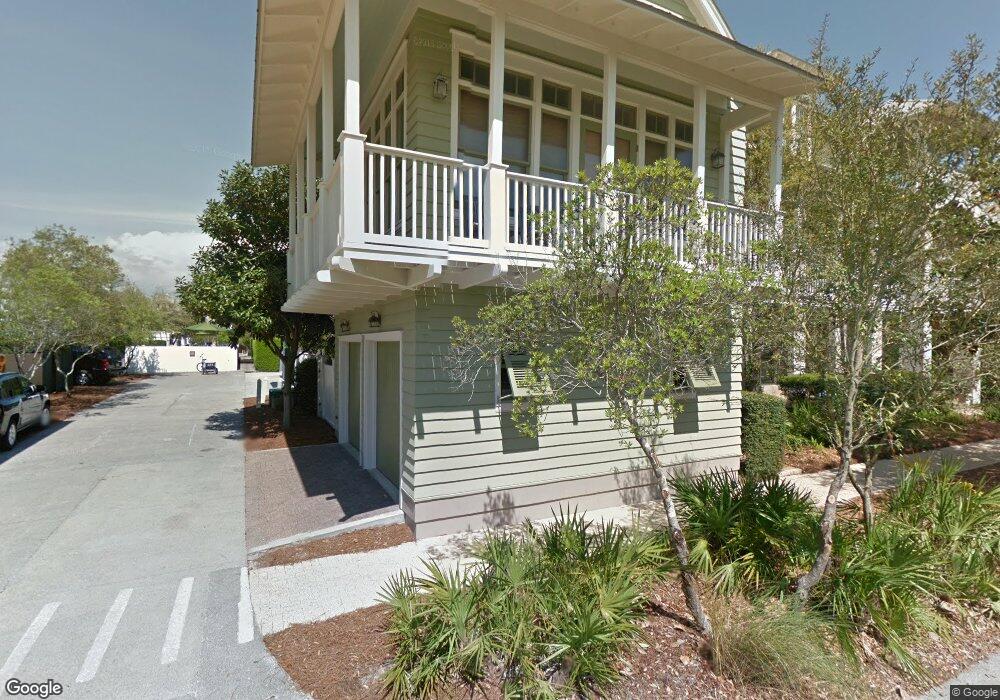
18 N Briland Ln Panama City Beach, FL 32413
Estimated Value: $3,074,037 - $3,713,000
3
Beds
3
Baths
2,174
Sq Ft
$1,535/Sq Ft
Est. Value
About This Home
This home is located at 18 N Briland Ln, Panama City Beach, FL 32413 and is currently estimated at $3,336,509, approximately $1,534 per square foot. 18 N Briland Ln is a home located in Walton County with nearby schools including Dune Lakes Elementary School, Emerald Coast Middle School, and South Walton High School.
Ownership History
Date
Name
Owned For
Owner Type
Purchase Details
Closed on
May 11, 2010
Sold by
Keliehor Investments Ltd
Bought by
Hutton Karen J
Current Estimated Value
Home Financials for this Owner
Home Financials are based on the most recent Mortgage that was taken out on this home.
Original Mortgage
$417,000
Outstanding Balance
$279,635
Interest Rate
5.06%
Estimated Equity
$3,056,874
Purchase Details
Closed on
Jun 2, 2008
Sold by
474 Club Llc
Bought by
Keliehor Investments Ltd
Purchase Details
Closed on
Jun 15, 2005
Sold by
Red Metal Roof Llc
Bought by
474 Club Llc
Home Financials for this Owner
Home Financials are based on the most recent Mortgage that was taken out on this home.
Original Mortgage
$1,912,500
Interest Rate
5.71%
Mortgage Type
Purchase Money Mortgage
Purchase Details
Closed on
Jun 25, 2004
Sold by
Anderson Betsy Brown and Brown Betsy Barron
Bought by
474 Llc and Red Metal Roff Llc
Purchase Details
Closed on
Jan 13, 2002
Sold by
Brown W Summer
Bought by
Brown Betty B
Create a Home Valuation Report for This Property
The Home Valuation Report is an in-depth analysis detailing your home's value as well as a comparison with similar homes in the area
Home Values in the Area
Average Home Value in this Area
Purchase History
| Date | Buyer | Sale Price | Title Company |
|---|---|---|---|
| Hutton Karen J | $1,095,000 | Mcneese Title Llc | |
| Keliehor Investments Ltd | $1,378,000 | Southern Escrow & Title Llc | |
| 474 Club Llc | $394,700 | -- | |
| 474 Llc | $1,532,500 | -- | |
| Brown Betty B | $275,000 | -- |
Source: Public Records
Mortgage History
| Date | Status | Borrower | Loan Amount |
|---|---|---|---|
| Open | Hutton Karen J | $417,000 | |
| Previous Owner | 474 Club Llc | $1,912,500 |
Source: Public Records
Tax History Compared to Growth
Tax History
| Year | Tax Paid | Tax Assessment Tax Assessment Total Assessment is a certain percentage of the fair market value that is determined by local assessors to be the total taxable value of land and additions on the property. | Land | Improvement |
|---|---|---|---|---|
| 2024 | $20,816 | $2,825,950 | $905,000 | $1,920,950 |
| 2023 | $20,816 | $1,960,837 | $0 | $0 |
| 2022 | $18,663 | $2,271,289 | $805,619 | $1,465,670 |
| 2021 | $15,686 | $1,620,526 | $671,088 | $949,438 |
| 2020 | $15,224 | $1,525,095 | $613,961 | $911,134 |
| 2019 | $14,762 | $1,486,474 | $596,079 | $890,395 |
| 2018 | $14,424 | $1,446,533 | $0 | $0 |
| 2017 | $13,674 | $1,422,426 | $562,368 | $860,058 |
| 2016 | $12,233 | $1,231,238 | $0 | $0 |
| 2015 | $11,458 | $1,149,202 | $0 | $0 |
| 2014 | $8,497 | $846,313 | $0 | $0 |
Source: Public Records
Map
Nearby Homes
- 171 Round Rd
- 52 Pinecrest Cir
- 30 Atwoods Ct
- 95 Rosemary Ave
- 10941 E County Highway 30a Unit 332
- 10941 E County Highway 30a Unit 125
- 10941 E County Highway 30a Unit 335
- 10941 E County Highway 30a Unit 325
- 106 N Winston Ln
- 84 Pine Crest Cir
- 122 N Winston Ln
- 87 Bourne Ln
- 114 Bourne Ln
- 16 S Green Turtle Ln
- 182 E Kingston Rd
- 34 N Barrett Unit 2D
- 92 E Water St
- 311 Walton Rose Ln
- 5 Main St Unit 1F
- 5 Main St Unit 2B
- 221 Rosemary Ave
- 22 N Briland Ln
- 10 N Briland Ln
- 206 Round Rd
- 25 S Belize Ln
- 19 N Briland Ln
- 241 Rosemary Ave
- 198 Round Rd
- 199 Rosemary Ave
- 222 Rosemary Ave
- 188 Round Rd
- 188 Round Rd
- 17 S Belize Ln
- 22 Atwoods Ln
- 18 Atwoods Ln
- 242 Rosemary Ave
- 28 S Belize Ln
- 33 S Briland Ln
- 6 S Briland Ln
- 216 Round Rd