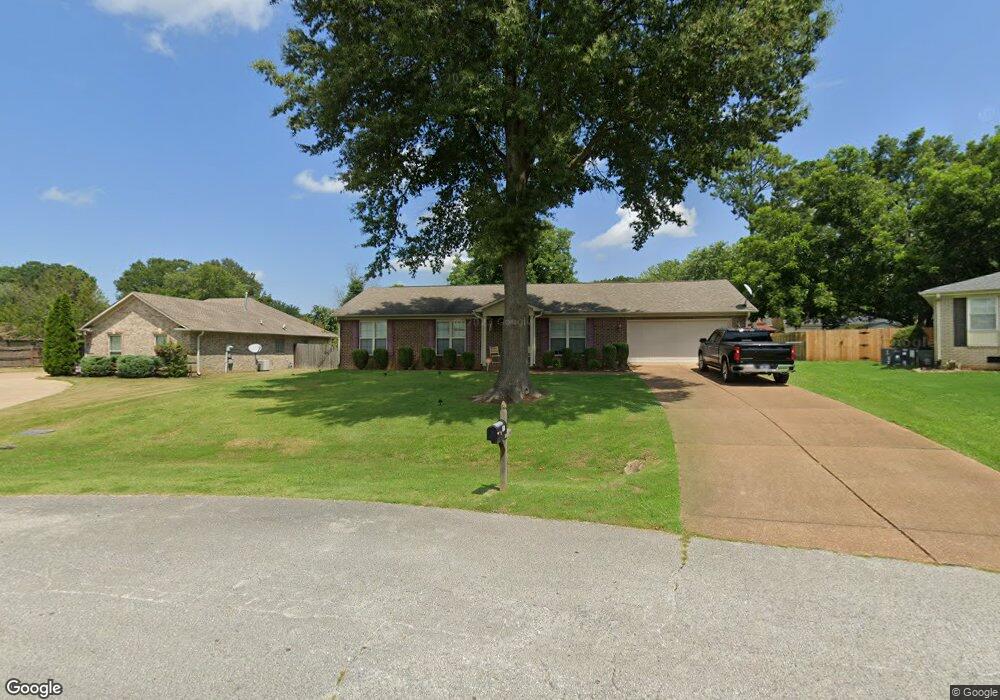
18 Navajo Cove Jackson, TN 38305
Estimated Value: $221,946 - $268,000
--
Bed
--
Bath
1,560
Sq Ft
$156/Sq Ft
Est. Value
About This Home
This home is located at 18 Navajo Cove, Jackson, TN 38305 and is currently estimated at $243,737, approximately $156 per square foot. 18 Navajo Cove is a home located in Madison County with nearby schools including Thelma Barker Elementary School, Northeast Middle School, and North Side High School.
Ownership History
Date
Name
Owned For
Owner Type
Purchase Details
Closed on
Mar 14, 2016
Sold by
Neely Terry
Bought by
Neely Terry
Current Estimated Value
Purchase Details
Closed on
Aug 24, 2007
Sold by
Terry Neely
Bought by
Terry Neely
Purchase Details
Closed on
Feb 18, 2004
Sold by
Damon Gorbet
Bought by
Terry Neely
Home Financials for this Owner
Home Financials are based on the most recent Mortgage that was taken out on this home.
Original Mortgage
$85,000
Interest Rate
5.63%
Purchase Details
Closed on
Jun 7, 2003
Bought by
Gorbet Damon
Purchase Details
Closed on
Jul 3, 1997
Sold by
Hamilton Baker Jan
Bought by
Baker Jan H
Purchase Details
Closed on
Jul 5, 1994
Sold by
Betty Gibbs
Bought by
Jan Baker
Purchase Details
Closed on
Jun 30, 1994
Sold by
Betty Gibbs
Bought by
Hamilton Baker Jan
Purchase Details
Closed on
Nov 8, 1984
Bought by
Massey Betty
Purchase Details
Closed on
Sep 26, 1978
Purchase Details
Closed on
Apr 25, 1975
Purchase Details
Closed on
Oct 4, 1974
Create a Home Valuation Report for This Property
The Home Valuation Report is an in-depth analysis detailing your home's value as well as a comparison with similar homes in the area
Home Values in the Area
Average Home Value in this Area
Purchase History
| Date | Buyer | Sale Price | Title Company |
|---|---|---|---|
| Neely Terry | -- | -- | |
| Terry Neely | -- | -- | |
| Terry Neely | $85,000 | -- | |
| Gorbet Damon | $58,300 | -- | |
| Baker Jan H | -- | -- | |
| Jan Baker | -- | -- | |
| Hamilton Baker Jan | -- | -- | |
| Massey Betty | -- | -- | |
| -- | -- | -- | |
| -- | -- | -- | |
| -- | -- | -- |
Source: Public Records
Mortgage History
| Date | Status | Borrower | Loan Amount |
|---|---|---|---|
| Previous Owner | Not Available | $85,000 |
Source: Public Records
Tax History Compared to Growth
Tax History
| Year | Tax Paid | Tax Assessment Tax Assessment Total Assessment is a certain percentage of the fair market value that is determined by local assessors to be the total taxable value of land and additions on the property. | Land | Improvement |
|---|---|---|---|---|
| 2024 | $834 | $44,525 | $5,000 | $39,525 |
| 2022 | $1,551 | $44,525 | $5,000 | $39,525 |
| 2021 | $1,332 | $30,875 | $3,500 | $27,375 |
| 2020 | $1,332 | $30,875 | $3,500 | $27,375 |
| 2019 | $1,332 | $30,875 | $3,500 | $27,375 |
| 2018 | $1,332 | $30,875 | $3,500 | $27,375 |
| 2017 | $1,304 | $29,550 | $3,500 | $26,050 |
| 2016 | $1,215 | $29,550 | $3,500 | $26,050 |
| 2015 | $1,215 | $29,550 | $3,500 | $26,050 |
| 2014 | $1,220 | $29,675 | $3,500 | $26,175 |
Source: Public Records
Map
Nearby Homes
- 66 Navajo Cove
- 52 Commanche Trail
- 3 Pueblo Cove
- 157 Commanche Trail
- 60 Marlow Dr
- 76 Moorewood Dr
- 27 Mill Creek Cove
- 23 Moorewood Dr
- 45 Countrywood Dr
- 75 Old Humboldt Rd
- 56 Braddock Place
- 7 Robinhood Ln
- 55 Brookstone Place
- 10 Richstone Cove
- 142 Northside Rd
- 11 Wyndhurst Dr
- 98 Volunteer Blvd
- 188 Quail Ridge
- 110 Volunteer Blvd
- 126 Volunteer Blvd