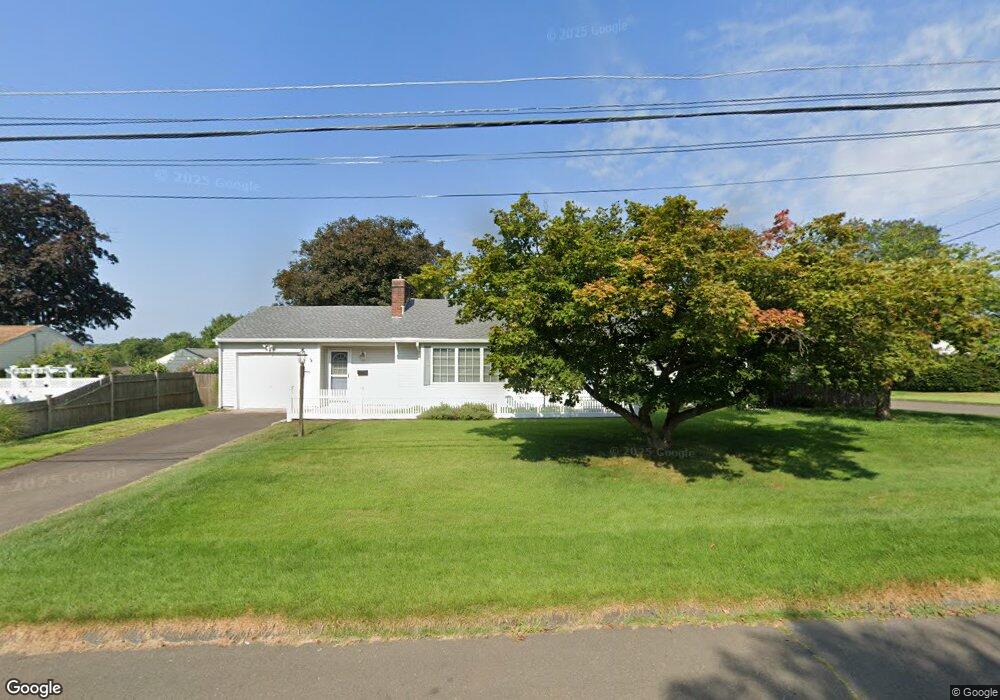
18 Poplar St Enfield, CT 06082
Estimated Value: $289,924 - $312,000
2
Beds
1
Bath
1,022
Sq Ft
$296/Sq Ft
Est. Value
About This Home
This home is located at 18 Poplar St, Enfield, CT 06082 and is currently estimated at $302,981, approximately $296 per square foot. 18 Poplar St is a home located in Hartford County with nearby schools including Enfield Street Elementary School, Edgar H. Parkman School, and John F. Kennedy Middle School.
Ownership History
Date
Name
Owned For
Owner Type
Purchase Details
Closed on
May 22, 2017
Sold by
Arrighini Christine A
Bought by
Arrighini Christine A and Arrighini Edmond R
Current Estimated Value
Purchase Details
Closed on
Feb 6, 2017
Sold by
Arrighini Edmond E
Bought by
Arrighini Christine A
Purchase Details
Closed on
Jun 18, 2014
Sold by
Melvin Michael F and Melvin Jean E
Bought by
Arrighini Edmond E and Arrighini Christine
Home Financials for this Owner
Home Financials are based on the most recent Mortgage that was taken out on this home.
Original Mortgage
$120,000
Interest Rate
4.21%
Mortgage Type
New Conventional
Purchase Details
Closed on
Jun 21, 2006
Sold by
Est Bourassa Gay H and Bourassa Guy
Bought by
Melvin Michael and Messenger Jean
Purchase Details
Closed on
Oct 17, 2003
Sold by
Engel Matthew and Bulle Amanda
Bought by
Bourassa Gay
Create a Home Valuation Report for This Property
The Home Valuation Report is an in-depth analysis detailing your home's value as well as a comparison with similar homes in the area
Home Values in the Area
Average Home Value in this Area
Purchase History
| Date | Buyer | Sale Price | Title Company |
|---|---|---|---|
| Arrighini Christine A | -- | -- | |
| Arrighini Christine A | -- | -- | |
| Arrighini Edmond E | $168,500 | -- | |
| Melvin Michael | $216,000 | -- | |
| Bourassa Gay | $170,000 | -- |
Source: Public Records
Mortgage History
| Date | Status | Borrower | Loan Amount |
|---|---|---|---|
| Previous Owner | Bourassa Gay | $120,000 | |
| Previous Owner | Bourassa Gay | $90,000 | |
| Previous Owner | Bourassa Gay | $50,000 |
Source: Public Records
Tax History Compared to Growth
Tax History
| Year | Tax Paid | Tax Assessment Tax Assessment Total Assessment is a certain percentage of the fair market value that is determined by local assessors to be the total taxable value of land and additions on the property. | Land | Improvement |
|---|---|---|---|---|
| 2025 | $4,563 | $130,400 | $46,900 | $83,500 |
| 2024 | $4,440 | $130,400 | $46,900 | $83,500 |
| 2023 | $4,408 | $130,400 | $46,900 | $83,500 |
| 2022 | $4,002 | $130,400 | $46,900 | $83,500 |
| 2021 | $3,857 | $102,770 | $38,860 | $63,910 |
| 2020 | $3,857 | $102,770 | $38,860 | $63,910 |
| 2019 | $3,867 | $102,770 | $38,860 | $63,910 |
| 2018 | $3,802 | $102,770 | $38,860 | $63,910 |
| 2017 | $3,590 | $102,770 | $38,860 | $63,910 |
| 2016 | $3,303 | $96,270 | $38,860 | $57,410 |
| 2015 | $1,818 | $96,270 | $38,860 | $57,410 |
| 2014 | $3,117 | $96,270 | $38,860 | $57,410 |
Source: Public Records
Map
Nearby Homes
- 5 Spier Ave
- 6 Hathaway Ave
- 1165 Enfield St Unit 11
- 8 Frew Terrace
- 33 Frew Terrace
- 1070 Enfield St
- 1015 Enfield St
- 53 New King St
- 69 Prospect St
- 20 Walnut St
- 78 Landing Cir Unit 78
- 54 Prospect St
- 88 High St
- 29 Primrose Ln
- 56 S River St
- 12 Thompson Ct
- 21 Pebblestone Cir
- 105 Spring Ln Unit 105
- 176 Dusky Ln Unit 176
- 180 Dusky Ln