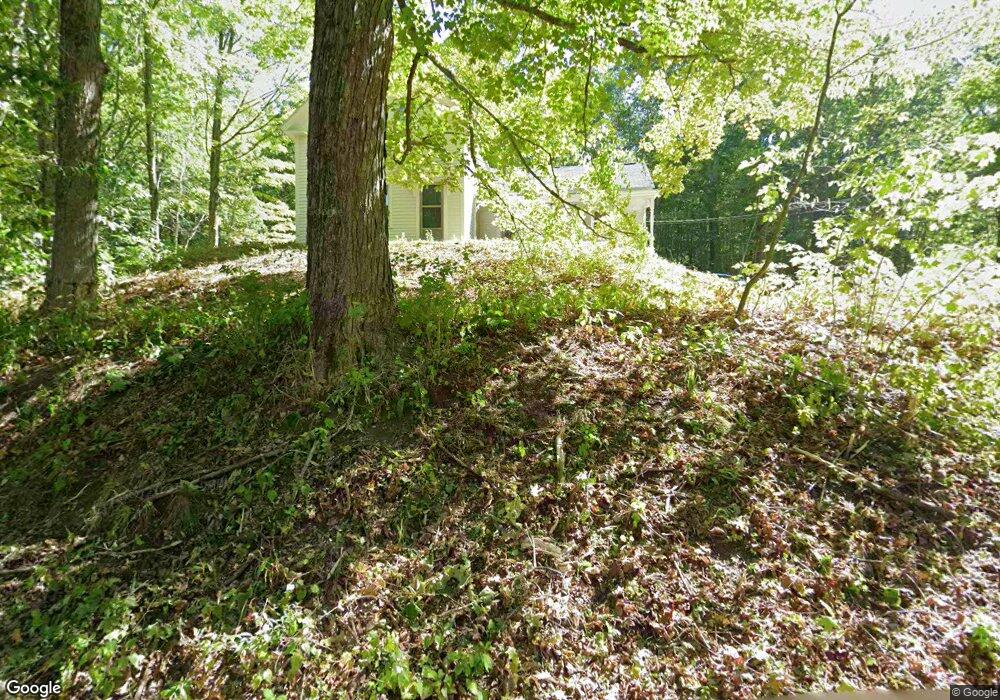
18 Proctor St Ashburnham, MA 01430
Estimated Value: $320,000 - $377,000
3
Beds
1
Bath
1,521
Sq Ft
$228/Sq Ft
Est. Value
About This Home
This home is located at 18 Proctor St, Ashburnham, MA 01430 and is currently estimated at $346,143, approximately $227 per square foot. 18 Proctor St is a home located in Worcester County with nearby schools including Oakmont Regional High School and Cushing Academy.
Ownership History
Date
Name
Owned For
Owner Type
Purchase Details
Closed on
Sep 19, 2022
Sold by
Dufour Robert N
Bought by
Dufour Jennie M
Current Estimated Value
Purchase Details
Closed on
Nov 4, 2013
Sold by
Dufour Robert N and Dufour Sandra A
Bought by
Dufour Robert N
Purchase Details
Closed on
Aug 22, 2012
Sold by
Dufour Robert N and Dufour Sandra A
Bought by
Dufour Robert N and Dufour Sandra A
Purchase Details
Closed on
Jun 21, 2012
Sold by
Dufour Sandra A and Dufour Robert N
Bought by
Dufour Robert N and Dufour Sandra A
Create a Home Valuation Report for This Property
The Home Valuation Report is an in-depth analysis detailing your home's value as well as a comparison with similar homes in the area
Home Values in the Area
Average Home Value in this Area
Purchase History
| Date | Buyer | Sale Price | Title Company |
|---|---|---|---|
| Dufour Jennie M | -- | None Available | |
| Dufour Jennie M | -- | None Available | |
| Dufour Robert N | -- | -- | |
| Dufour Robert N | -- | -- | |
| Dufour Robert N | -- | -- | |
| Dufour Robert N | -- | -- | |
| Dufour Robert N | -- | -- | |
| Dufour Robert N | -- | -- |
Source: Public Records
Mortgage History
| Date | Status | Borrower | Loan Amount |
|---|---|---|---|
| Previous Owner | Dufour Robert N | $145,000 | |
| Previous Owner | Dufour Robert N | $81,000 |
Source: Public Records
Tax History
| Year | Tax Paid | Tax Assessment Tax Assessment Total Assessment is a certain percentage of the fair market value that is determined by local assessors to be the total taxable value of land and additions on the property. | Land | Improvement |
|---|---|---|---|---|
| 2025 | $4,253 | $286,000 | $52,900 | $233,100 |
| 2024 | $4,175 | $265,100 | $52,600 | $212,500 |
| 2023 | $4,270 | $258,000 | $52,600 | $205,400 |
| 2022 | $4,297 | $227,600 | $48,400 | $179,200 |
| 2021 | $4,281 | $208,300 | $48,400 | $159,900 |
| 2020 | $4,187 | $208,300 | $48,400 | $159,900 |
| 2019 | $3,775 | $167,400 | $48,400 | $119,000 |
| 2018 | $3,669 | $156,800 | $45,800 | $111,000 |
| 2017 | $3,505 | $152,600 | $42,700 | $109,900 |
| 2016 | $3,406 | $149,700 | $42,100 | $107,600 |
| 2015 | $3,355 | $150,600 | $42,100 | $108,500 |
Source: Public Records
Map
Nearby Homes
Your Personal Tour Guide
Ask me questions while you tour the home.