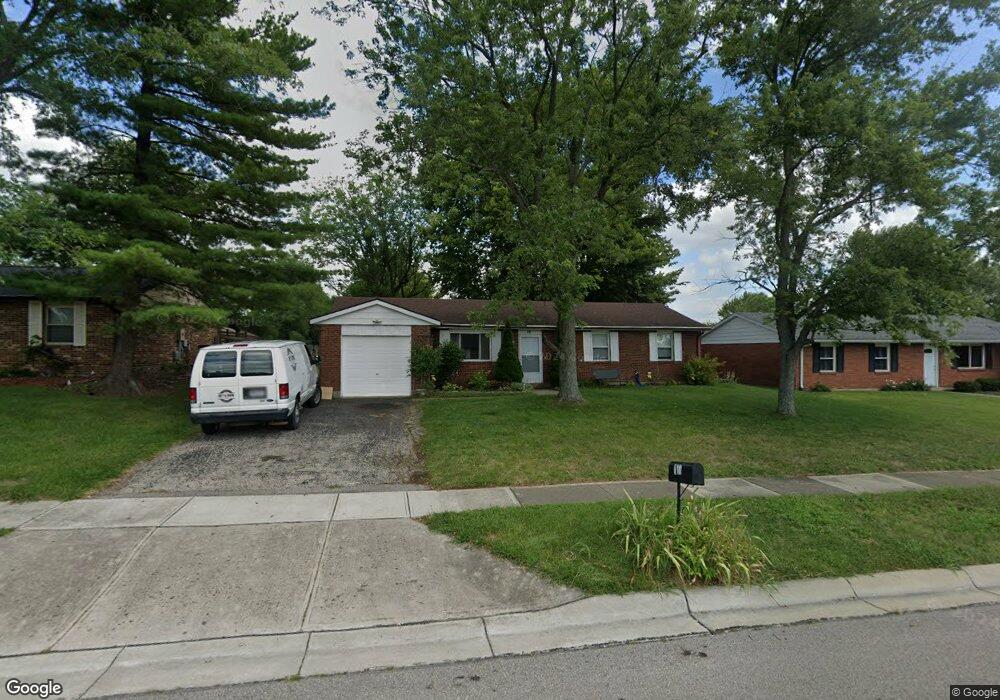
18 Raintree Trail Lebanon, OH 45036
Estimated Value: $241,352 - $277,000
3
Beds
2
Baths
1,208
Sq Ft
$211/Sq Ft
Est. Value
About This Home
This home is located at 18 Raintree Trail, Lebanon, OH 45036 and is currently estimated at $255,088, approximately $211 per square foot. 18 Raintree Trail is a home located in Warren County with nearby schools including Bowman Primary School, Berry Intermediate School, and Donovan Elementary School.
Ownership History
Date
Name
Owned For
Owner Type
Purchase Details
Closed on
Jul 24, 2003
Sold by
Helsinger Tanya
Bought by
Larlos Omar and Cortez Ana C
Current Estimated Value
Home Financials for this Owner
Home Financials are based on the most recent Mortgage that was taken out on this home.
Original Mortgage
$111,155
Outstanding Balance
$47,400
Interest Rate
5.3%
Mortgage Type
FHA
Estimated Equity
$207,688
Purchase Details
Closed on
Nov 9, 1999
Sold by
Finley James D
Bought by
Helsinger Tanya
Home Financials for this Owner
Home Financials are based on the most recent Mortgage that was taken out on this home.
Original Mortgage
$77,875
Interest Rate
7.78%
Mortgage Type
New Conventional
Purchase Details
Closed on
Nov 9, 1993
Sold by
Ehling William C and Ehling Ceci
Bought by
Finley and Finley James D
Purchase Details
Closed on
Jul 19, 1979
Sold by
Walnut Hills Co
Purchase Details
Closed on
Aug 21, 1978
Sold by
Walnut Hills Company
Create a Home Valuation Report for This Property
The Home Valuation Report is an in-depth analysis detailing your home's value as well as a comparison with similar homes in the area
Home Values in the Area
Average Home Value in this Area
Purchase History
| Date | Buyer | Sale Price | Title Company |
|---|---|---|---|
| Larlos Omar | $112,900 | Attorney Title Agency | |
| Helsinger Tanya | $96,000 | -- | |
| Finley | $82,600 | -- | |
| -- | $45,500 | -- | |
| -- | -- | -- |
Source: Public Records
Mortgage History
| Date | Status | Borrower | Loan Amount |
|---|---|---|---|
| Open | Larlos Omar | $111,155 | |
| Previous Owner | Helsinger Tanya | $77,875 |
Source: Public Records
Tax History Compared to Growth
Tax History
| Year | Tax Paid | Tax Assessment Tax Assessment Total Assessment is a certain percentage of the fair market value that is determined by local assessors to be the total taxable value of land and additions on the property. | Land | Improvement |
|---|---|---|---|---|
| 2024 | $2,606 | $62,760 | $21,000 | $41,760 |
| 2023 | $2,212 | $47,873 | $10,762 | $37,110 |
| 2022 | $2,306 | $47,873 | $10,763 | $37,111 |
| 2021 | $2,179 | $47,873 | $10,763 | $37,111 |
| 2020 | $2,098 | $38,920 | $8,750 | $30,170 |
| 2019 | $2,108 | $38,920 | $8,750 | $30,170 |
| 2018 | $1,806 | $38,920 | $8,750 | $30,170 |
| 2017 | $1,695 | $32,771 | $7,480 | $25,291 |
| 2016 | $1,749 | $32,771 | $7,480 | $25,291 |
| 2015 | $1,762 | $32,771 | $7,480 | $25,291 |
| 2014 | $1,835 | $32,770 | $7,480 | $25,290 |
| 2013 | $1,765 | $38,330 | $8,750 | $29,580 |
Source: Public Records
Map
Nearby Homes
- 1 Dryhill Ct
- 1112 Hubbell Ct
- 1443 N Broadway St
- 917 Kerns Dr
- 911 Birchwood Dr
- 11 Roxie Ct
- 908 Hartz Dr
- 465 Creekside Dr
- 1033 Country Creek Dr
- 5 Acres Lot D Phillips Rd
- 409 Bethpage Way Unit 7-301
- 5 Acres Ave
- 409 Bethpage Way
- 364 Grey's Run
- 351 Grey's Run
- 376 Grey's Run
- 531 Quail Ct
- 532 French Run Ct
- 19 Hathaway Commons
- 229 Dickens Ct
- 16 Raintree Trail
- 20 Raintree Trail
- 14 Raintree Trail
- 22 Raintree Trail
- 19 Edmon Ct
- 17 Raintree Trail
- 21 Edmon Ct
- 21 Raintree Trail
- 12 Raintree Trail
- 24 Raintree Trail
- 1051 Winding Way
- 941 Rainbow Ct
- 23 Edmon Ct
- 1048 Winding Way
- 18 Edmon Ct
- 10 Raintree Trail
- 26 Raintree Trail
- 11 Raintree Trail
- 25 Raintree Trail
- 939 Rainbow Ct