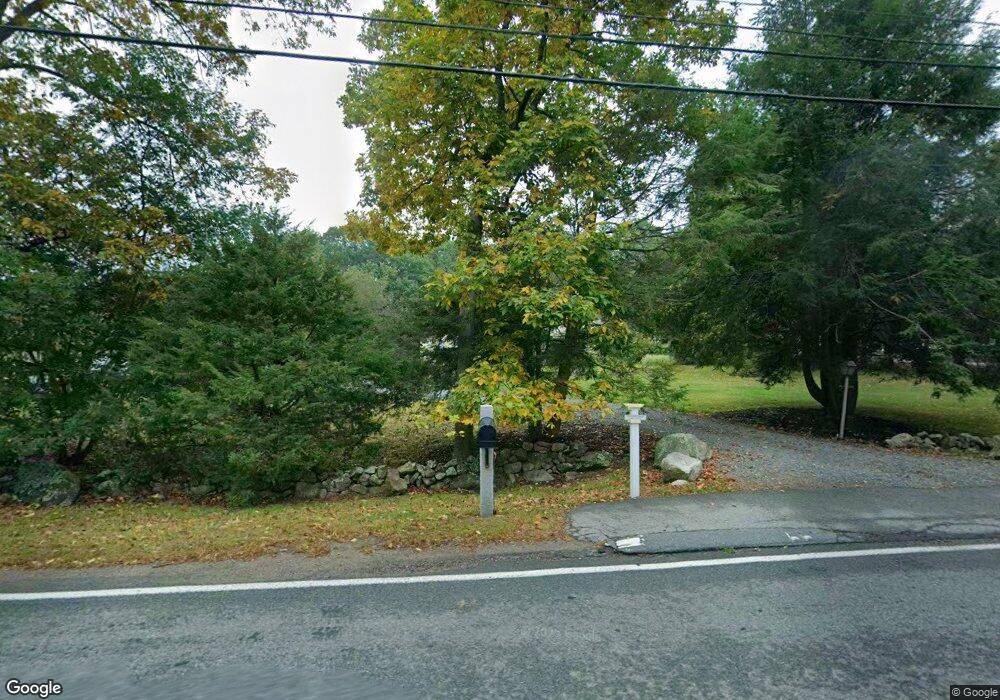
18 Rubbly Rd Wenham, MA 01984
Estimated Value: $958,000 - $1,123,000
3
Beds
2
Baths
2,200
Sq Ft
$466/Sq Ft
Est. Value
About This Home
This home is located at 18 Rubbly Rd, Wenham, MA 01984 and is currently estimated at $1,026,172, approximately $466 per square foot. 18 Rubbly Rd is a home located in Essex County with nearby schools including Winthrop School, Cutler Elementary School, and Miles River Middle School.
Ownership History
Date
Name
Owned For
Owner Type
Purchase Details
Closed on
Oct 6, 2020
Sold by
Rand Philip A and Rand Tara K
Bought by
Clark Chrsitina and Clark Steven
Current Estimated Value
Home Financials for this Owner
Home Financials are based on the most recent Mortgage that was taken out on this home.
Original Mortgage
$510,000
Outstanding Balance
$451,562
Interest Rate
2.9%
Mortgage Type
New Conventional
Estimated Equity
$574,610
Purchase Details
Closed on
Jan 26, 1996
Sold by
Bochman Jeffrey and Bochman Kathleen
Bought by
Rand Philip A and Rand Tara
Purchase Details
Closed on
Jul 8, 1994
Sold by
Bradley Rose
Bought by
Bochman Jeffrey and Bochman Kathleen
Purchase Details
Closed on
Sep 24, 1987
Sold by
Bradley Rose F
Bought by
Bradley Rose F
Create a Home Valuation Report for This Property
The Home Valuation Report is an in-depth analysis detailing your home's value as well as a comparison with similar homes in the area
Home Values in the Area
Average Home Value in this Area
Purchase History
| Date | Buyer | Sale Price | Title Company |
|---|---|---|---|
| Clark Chrsitina | $725,000 | None Available | |
| Rand Philip A | $285,000 | -- | |
| Rand Philip A | $285,000 | -- | |
| Bochman Jeffrey | $285,000 | -- | |
| Bochman Jeffrey | $285,000 | -- | |
| Bradley Rose F | $68,000 | -- |
Source: Public Records
Mortgage History
| Date | Status | Borrower | Loan Amount |
|---|---|---|---|
| Open | Clark Chrsitina | $510,000 | |
| Previous Owner | Bradley Rose F | $146,505 | |
| Previous Owner | Bradley Rose F | $322,000 |
Source: Public Records
Tax History Compared to Growth
Tax History
| Year | Tax Paid | Tax Assessment Tax Assessment Total Assessment is a certain percentage of the fair market value that is determined by local assessors to be the total taxable value of land and additions on the property. | Land | Improvement |
|---|---|---|---|---|
| 2025 | $14,308 | $920,700 | $558,100 | $362,600 |
| 2024 | $14,089 | $899,700 | $558,100 | $341,600 |
| 2023 | $13,812 | $796,100 | $538,400 | $257,700 |
| 2022 | $12,114 | $618,700 | $369,600 | $249,100 |
| 2021 | $11,637 | $591,300 | $342,200 | $249,100 |
| 2020 | $10,843 | $572,500 | $342,200 | $230,300 |
| 2019 | $10,316 | $572,500 | $342,200 | $230,300 |
| 2018 | $9,577 | $509,700 | $331,200 | $178,500 |
| 2017 | $9,343 | $509,700 | $331,200 | $178,500 |
| 2016 | $8,655 | $509,700 | $331,200 | $178,500 |
| 2015 | $8,283 | $509,700 | $331,200 | $178,500 |
Source: Public Records
Map
Nearby Homes
- 12 Rubbly Rd
- 24 Rubbly Rd
- 6 Rubbly Rd
- 141 Grapevine Rd
- 143 Grapevine Rd
- 140 Grapevine Rd
- 136 Grapevine Rd
- 29 Rubbly Rd
- 25 Rubbly Rd
- 142 Grapevine Rd
- 144 Grapevine Rd
- 155 Grapevine Rd
- 1 Partridgeberry Ln
- 2 Danes Way
- 1 Charles Davis Dr
- 118 Grapevine Rd
- 118 Grapevine Rd Unit 118
- 2 Charles Davis Dr
- 24 Woodbury St
- 157 Grapevine Rd