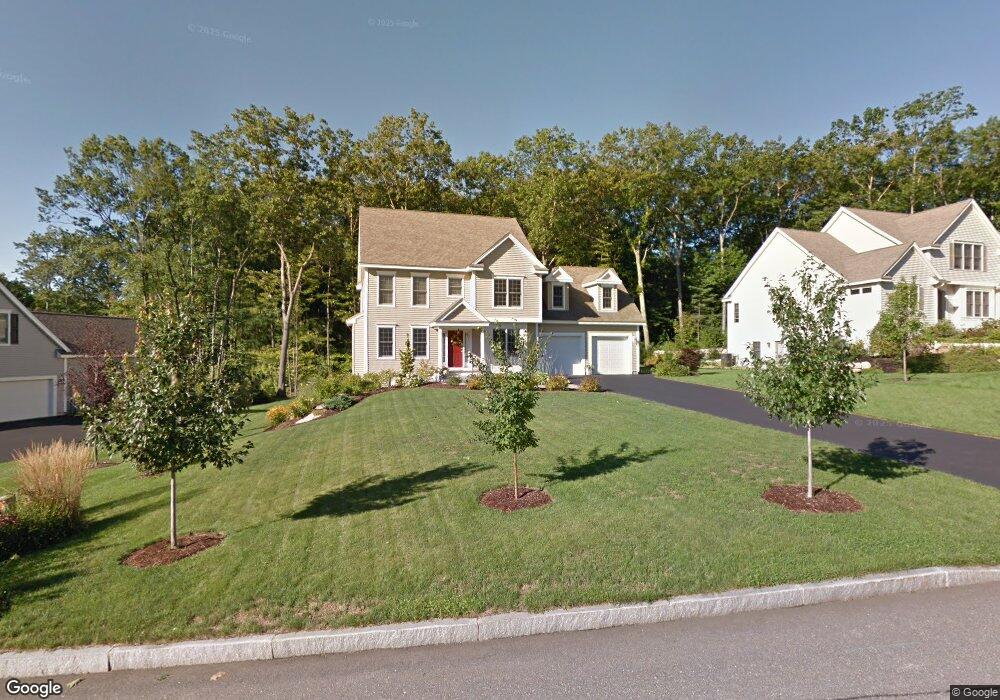
18 Samuel Dr Concord, NH 03301
North End NeighborhoodEstimated Value: $779,513 - $864,000
4
Beds
4
Baths
2,554
Sq Ft
$324/Sq Ft
Est. Value
About This Home
This home is located at 18 Samuel Dr, Concord, NH 03301 and is currently estimated at $828,128, approximately $324 per square foot. 18 Samuel Dr is a home located in Merrimack County with nearby schools including Christa McAuliffe School, Rundlett Middle School, and Concord High School.
Ownership History
Date
Name
Owned For
Owner Type
Purchase Details
Closed on
Aug 29, 2018
Sold by
Wells Jeffry S and Wells Martha T
Bought by
Jeffry Wells Ret
Current Estimated Value
Purchase Details
Closed on
May 9, 2007
Sold by
Samuel Drive Llc
Bought by
Wells Jeffry S and Wells Martha T
Home Financials for this Owner
Home Financials are based on the most recent Mortgage that was taken out on this home.
Original Mortgage
$466,450
Interest Rate
6.21%
Mortgage Type
Purchase Money Mortgage
Create a Home Valuation Report for This Property
The Home Valuation Report is an in-depth analysis detailing your home's value as well as a comparison with similar homes in the area
Home Values in the Area
Average Home Value in this Area
Purchase History
We collect this data history from publicly available records. To have your information removed, we recommend requesting removal directly through your county’s website.
| Date | Buyer | Sale Price | Title Company |
|---|---|---|---|
| Jeffry Wells Ret | -- | -- | |
| Wells Jeffry S | $120,000 | -- |
Source: Public Records
Mortgage History
We collect this data history from publicly available records. To have your information removed, we recommend requesting removal directly through your county’s website.
| Date | Status | Borrower | Loan Amount |
|---|---|---|---|
| Previous Owner | Wells Jeffry S | $50,000 | |
| Previous Owner | Wells Jeffry S | $310,000 | |
| Previous Owner | Wells Jeffry S | $466,450 |
Source: Public Records
Tax History
| Year | Tax Paid | Tax Assessment Tax Assessment Total Assessment is a certain percentage of the fair market value that is determined by local assessors to be the total taxable value of land and additions on the property. | Land | Improvement |
|---|---|---|---|---|
| 2025 | $14,436 | $495,900 | $126,300 | $369,600 |
| 2024 | $14,186 | $512,300 | $126,300 | $386,000 |
| 2023 | $13,760 | $512,300 | $126,300 | $386,000 |
| 2022 | $13,263 | $512,300 | $126,300 | $386,000 |
| 2021 | $12,819 | $510,300 | $126,300 | $384,000 |
| 2020 | $12,601 | $470,900 | $105,400 | $365,500 |
| 2019 | $12,704 | $457,300 | $112,500 | $344,800 |
| 2018 | $12,437 | $446,200 | $112,900 | $333,300 |
| 2017 | $12,310 | $435,900 | $112,900 | $323,000 |
| 2016 | $11,801 | $426,500 | $112,900 | $313,600 |
| 2015 | $11,781 | $430,900 | $98,100 | $332,800 |
| 2014 | $11,552 | $430,900 | $98,100 | $332,800 |
| 2013 | $10,943 | $427,800 | $98,100 | $329,700 |
| 2012 | $10,401 | $426,800 | $103,400 | $323,400 |
Source: Public Records
Map
Nearby Homes
Your Personal Tour Guide
Ask me questions while you tour the home.