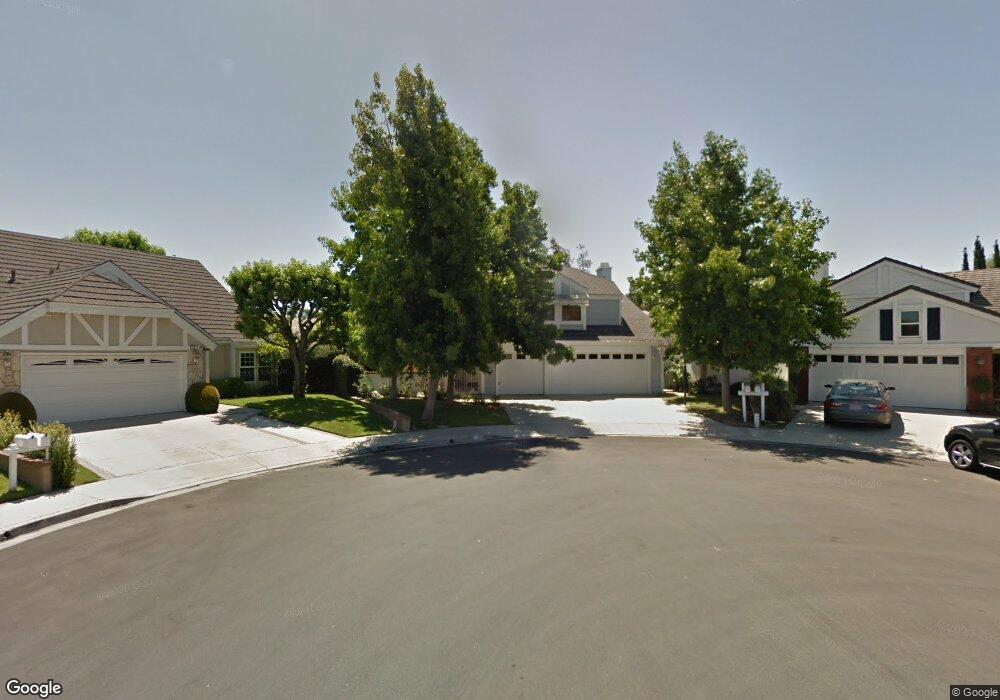
18 Sheridan Irvine, CA 92620
Northwood NeighborhoodEstimated Value: $1,853,000 - $1,956,000
4
Beds
3
Baths
2,453
Sq Ft
$771/Sq Ft
Est. Value
About This Home
This home is located at 18 Sheridan, Irvine, CA 92620 and is currently estimated at $1,892,172, approximately $771 per square foot. 18 Sheridan is a home located in Orange County with nearby schools including Northwood Elementary School, Sierra Vista Middle School, and Northwood High School.
Ownership History
Date
Name
Owned For
Owner Type
Purchase Details
Closed on
Mar 28, 2013
Sold by
Hand Gregory S and Hand Kristin
Bought by
Hand Gregory S and Hand Kristin
Current Estimated Value
Home Financials for this Owner
Home Financials are based on the most recent Mortgage that was taken out on this home.
Original Mortgage
$625,500
Outstanding Balance
$442,915
Interest Rate
3.54%
Mortgage Type
New Conventional
Estimated Equity
$1,449,257
Purchase Details
Closed on
Jul 2, 2007
Sold by
Gift Craig and Kishimoto Sakura
Bought by
Hand Gregory S and Han Kristin
Home Financials for this Owner
Home Financials are based on the most recent Mortgage that was taken out on this home.
Original Mortgage
$684,000
Interest Rate
6.65%
Mortgage Type
Purchase Money Mortgage
Purchase Details
Closed on
Apr 19, 2005
Sold by
Vande Water Derek A and Van De Water Lisa
Bought by
Gift Craig and Kishimoto Sakura
Purchase Details
Closed on
Dec 10, 2002
Sold by
Oh Byung Ho
Bought by
Vandewater Derek A and Vandewater Lisa
Home Financials for this Owner
Home Financials are based on the most recent Mortgage that was taken out on this home.
Original Mortgage
$405,600
Interest Rate
5.25%
Purchase Details
Closed on
Mar 20, 2000
Sold by
Oh Choon Ja
Bought by
Oh Byung Ho
Home Financials for this Owner
Home Financials are based on the most recent Mortgage that was taken out on this home.
Original Mortgage
$274,900
Interest Rate
8.26%
Mortgage Type
Stand Alone First
Purchase Details
Closed on
Oct 5, 1993
Sold by
Sprague William and Sprague Olivette
Bought by
Hiller Mark A and Hiller Xiomara J
Home Financials for this Owner
Home Financials are based on the most recent Mortgage that was taken out on this home.
Original Mortgage
$243,200
Interest Rate
6.88%
Create a Home Valuation Report for This Property
The Home Valuation Report is an in-depth analysis detailing your home's value as well as a comparison with similar homes in the area
Home Values in the Area
Average Home Value in this Area
Purchase History
| Date | Buyer | Sale Price | Title Company |
|---|---|---|---|
| Hand Gregory S | -- | Ticor Title Company Of Ca | |
| Hand Gregory S | $855,000 | Equity Title Company | |
| Gift Craig | $940,000 | Alliance Title | |
| Vandewater Derek A | $507,000 | Ticor | |
| Oh Byung Ho | -- | South Coast Title | |
| Oh Byung Ho | $425,000 | South Coast Title | |
| Hiller Mark A | $304,000 | South Coast Title Company |
Source: Public Records
Mortgage History
| Date | Status | Borrower | Loan Amount |
|---|---|---|---|
| Open | Hand Gregory S | $625,500 | |
| Closed | Hand Gregory S | $684,000 | |
| Previous Owner | Vandewater Derek A | $405,600 | |
| Previous Owner | Oh Byung Ho | $274,900 | |
| Previous Owner | Hiller Mark A | $243,200 |
Source: Public Records
Tax History
| Year | Tax Paid | Tax Assessment Tax Assessment Total Assessment is a certain percentage of the fair market value that is determined by local assessors to be the total taxable value of land and additions on the property. | Land | Improvement |
|---|---|---|---|---|
| 2025 | $11,537 | $1,123,052 | $856,057 | $266,995 |
| 2024 | $11,537 | $1,101,032 | $839,272 | $261,760 |
| 2023 | $11,238 | $1,079,444 | $822,816 | $256,628 |
| 2022 | $11,028 | $1,058,279 | $806,682 | $251,597 |
| 2021 | $10,777 | $1,037,529 | $790,865 | $246,664 |
| 2020 | $10,717 | $1,026,891 | $782,756 | $244,135 |
| 2019 | $10,478 | $1,006,756 | $767,407 | $239,349 |
| 2018 | $10,294 | $987,016 | $752,360 | $234,656 |
| 2017 | $10,082 | $967,663 | $737,608 | $230,055 |
| 2016 | $9,533 | $939,000 | $723,145 | $215,855 |
| 2015 | $8,795 | $865,650 | $662,376 | $203,274 |
| 2014 | $8,793 | $865,650 | $662,376 | $203,274 |
Source: Public Records
Map
Nearby Homes
- 4 Carson
- 6 Gettysburg
- 18 Harrisburg
- 30 Jefferson
- 22 Hunter
- 22 Yorktown
- 66 Bridgeport
- 39 Cape Cod
- 27 Torrey Pine
- 84 Jade Flower
- 65 Remington Unit 232
- 30 Remington
- 306 Streamwood
- 54 Shadowplay
- 229 Springview Unit 229
- 7 Chattanooga
- 73 Huntington Unit 322
- 83 Huntington Unit 278
- 127 Huntington Unit 257
- 93 Streamwood
Your Personal Tour Guide
Ask me questions while you tour the home.