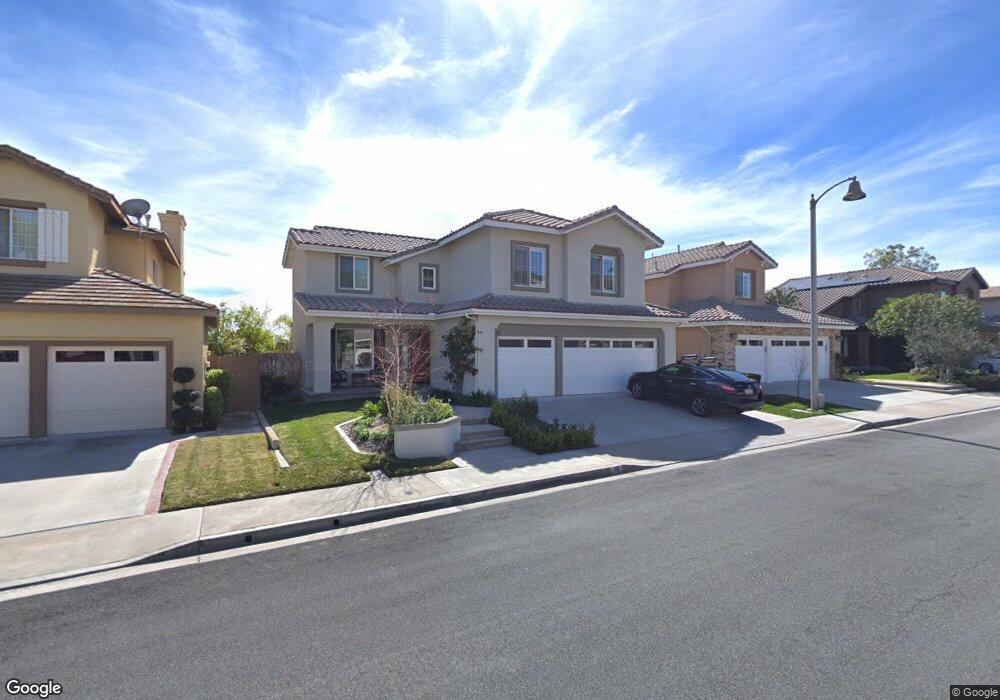
18 Tizmin Foothill Ranch, CA 92610
Estimated Value: $1,347,524 - $1,450,000
4
Beds
3
Baths
2,260
Sq Ft
$618/Sq Ft
Est. Value
About This Home
This home is located at 18 Tizmin, Foothill Ranch, CA 92610 and is currently estimated at $1,396,881, approximately $618 per square foot. 18 Tizmin is a home located in Orange County with nearby schools including Foothill Ranch Elementary School, Rancho Santa Margarita Intermediate School, and Trabuco Hills High School.
Ownership History
Date
Name
Owned For
Owner Type
Purchase Details
Closed on
Sep 27, 2020
Sold by
Young Darren M and Young Nancy M
Bought by
Young Darren M and Young Nancy M
Current Estimated Value
Home Financials for this Owner
Home Financials are based on the most recent Mortgage that was taken out on this home.
Original Mortgage
$401,000
Outstanding Balance
$288,213
Interest Rate
2.9%
Mortgage Type
New Conventional
Estimated Equity
$1,108,668
Purchase Details
Closed on
Oct 28, 2011
Sold by
Young Darren M and Yong Nancy M
Bought by
Young Darren M and Young Nancy M
Purchase Details
Closed on
Jan 29, 2009
Sold by
Young Darren M and Young Nancy M
Bought by
Young Darren M and Young Nancy M
Home Financials for this Owner
Home Financials are based on the most recent Mortgage that was taken out on this home.
Original Mortgage
$417,000
Interest Rate
5.01%
Mortgage Type
New Conventional
Purchase Details
Closed on
Nov 3, 2004
Sold by
Young Darren M and Young Nancy M
Bought by
Young Darren M and Young Nancy M
Purchase Details
Closed on
Apr 4, 2003
Sold by
Young Darren M and Young Nancy M
Bought by
Young Darren M and Young Nancy M
Home Financials for this Owner
Home Financials are based on the most recent Mortgage that was taken out on this home.
Original Mortgage
$208,500
Interest Rate
5.73%
Purchase Details
Closed on
Jan 27, 2003
Sold by
Young Darren M and Young Nancy M
Bought by
Young Darren M and Young Nancy M
Purchase Details
Closed on
Feb 27, 1997
Sold by
George Long and George Lorraine
Bought by
Young Darren and Young Nancy
Home Financials for this Owner
Home Financials are based on the most recent Mortgage that was taken out on this home.
Original Mortgage
$211,500
Interest Rate
7.66%
Mortgage Type
Balloon
Purchase Details
Closed on
Mar 15, 1994
Sold by
The Fieldstone Company
Bought by
Long George A and Long Lorraine J
Home Financials for this Owner
Home Financials are based on the most recent Mortgage that was taken out on this home.
Original Mortgage
$193,950
Interest Rate
8.1%
Create a Home Valuation Report for This Property
The Home Valuation Report is an in-depth analysis detailing your home's value as well as a comparison with similar homes in the area
Home Values in the Area
Average Home Value in this Area
Purchase History
| Date | Buyer | Sale Price | Title Company |
|---|---|---|---|
| Young Darren M | -- | Lawyers Title | |
| Young Darren M | -- | Lawyers Title Ie | |
| Young Darren M | -- | Accommodation | |
| Young Darren M | -- | Accommodation | |
| Young Darren M | -- | Nations Title Company Of Ca | |
| Young Darren M | -- | Nations Title Company Of Ca | |
| Young Darren M | -- | -- | |
| Young Darren M | -- | American Title Co | |
| Young Darren M | -- | -- | |
| Young Darren | $235,000 | Fidelity National Title | |
| Long George A | $224,000 | First American Title Ins |
Source: Public Records
Mortgage History
| Date | Status | Borrower | Loan Amount |
|---|---|---|---|
| Open | Young Darren M | $401,000 | |
| Previous Owner | Young Darren M | $417,000 | |
| Previous Owner | Young Darren M | $208,500 | |
| Previous Owner | Young Darren | $211,500 | |
| Previous Owner | Long George A | $193,950 |
Source: Public Records
Tax History
| Year | Tax Paid | Tax Assessment Tax Assessment Total Assessment is a certain percentage of the fair market value that is determined by local assessors to be the total taxable value of land and additions on the property. | Land | Improvement |
|---|---|---|---|---|
| 2025 | $4,193 | $418,417 | $96,490 | $321,927 |
| 2024 | $4,193 | $410,213 | $94,598 | $315,615 |
| 2023 | $4,093 | $402,170 | $92,743 | $309,427 |
| 2022 | $4,018 | $394,285 | $90,925 | $303,360 |
| 2021 | $2,955 | $386,554 | $89,142 | $297,412 |
| 2020 | $3,901 | $382,591 | $88,228 | $294,363 |
| 2019 | $3,822 | $375,090 | $86,498 | $288,592 |
| 2018 | $3,749 | $367,736 | $84,802 | $282,934 |
| 2017 | $3,673 | $360,526 | $83,139 | $277,387 |
| 2016 | $4,733 | $353,457 | $81,508 | $271,949 |
| 2015 | $4,689 | $341,667 | $80,284 | $261,383 |
| 2014 | $5,632 | $334,975 | $78,712 | $256,263 |
Source: Public Records
Map
Nearby Homes
- 5 Encinal
- 2 Alamitos
- 32 Salinas
- 20 Flores
- 64 Calle Cabrillo
- 18 Alonda
- 18 Cagney
- 38 Tessera Ave
- 19431 Rue de Valore Unit 19B
- 208 Chaumont Cir Unit 113
- 277 Chaumont Cir
- 19431 14H Rue de Valore
- 19431 57D Rue de Valore
- 406 El Paseo
- 39 Touraine Place
- 16 Balustrade Place
- 115 Primrose Dr
- 192 Finch
- 120 Chapman
- 191 Evergreen Way
Your Personal Tour Guide
Ask me questions while you tour the home.