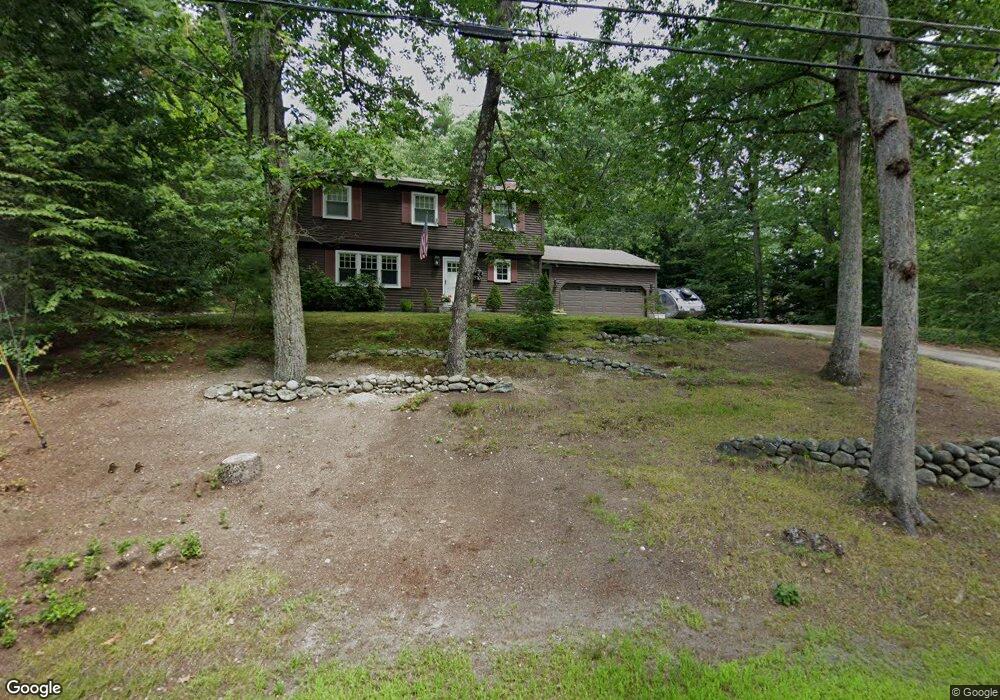
18 Truell Rd Hollis, NH 03049
Hollis NeighborhoodEstimated Value: $636,032 - $716,000
4
Beds
3
Baths
1,944
Sq Ft
$350/Sq Ft
Est. Value
About This Home
This home is located at 18 Truell Rd, Hollis, NH 03049 and is currently estimated at $679,508, approximately $349 per square foot. 18 Truell Rd is a home with nearby schools including Hollis Primary School, Hollis Upper Elementary School, and Hollis-Brookline Middle School.
Ownership History
Date
Name
Owned For
Owner Type
Purchase Details
Closed on
Aug 4, 2017
Sold by
Williams Richard J and Williams Mary M
Bought by
Williams Ft
Current Estimated Value
Purchase Details
Closed on
Jun 10, 1996
Sold by
Lacker William R and Lacker Marion S
Bought by
Williams Richard J
Home Financials for this Owner
Home Financials are based on the most recent Mortgage that was taken out on this home.
Original Mortgage
$127,600
Interest Rate
7.89%
Create a Home Valuation Report for This Property
The Home Valuation Report is an in-depth analysis detailing your home's value as well as a comparison with similar homes in the area
Home Values in the Area
Average Home Value in this Area
Purchase History
| Date | Buyer | Sale Price | Title Company |
|---|---|---|---|
| Williams Ft | -- | -- | |
| Williams Richard J | $159,500 | -- |
Source: Public Records
Mortgage History
| Date | Status | Borrower | Loan Amount |
|---|---|---|---|
| Previous Owner | Williams Richard J | $181,000 | |
| Previous Owner | Williams Richard J | $127,600 |
Source: Public Records
Tax History Compared to Growth
Tax History
| Year | Tax Paid | Tax Assessment Tax Assessment Total Assessment is a certain percentage of the fair market value that is determined by local assessors to be the total taxable value of land and additions on the property. | Land | Improvement |
|---|---|---|---|---|
| 2024 | $9,314 | $525,300 | $272,100 | $253,200 |
| 2023 | $8,751 | $525,300 | $272,100 | $253,200 |
| 2022 | $11,856 | $525,300 | $272,100 | $253,200 |
| 2021 | $7,312 | $322,100 | $160,200 | $161,900 |
| 2020 | $7,466 | $322,100 | $160,200 | $161,900 |
| 2019 | $7,441 | $322,100 | $160,200 | $161,900 |
| 2018 | $6,763 | $322,100 | $160,200 | $161,900 |
| 2017 | $6,804 | $293,900 | $140,200 | $153,700 |
| 2016 | $6,886 | $293,900 | $140,200 | $153,700 |
| 2015 | $6,766 | $293,900 | $140,200 | $153,700 |
| 2014 | $6,798 | $293,900 | $140,200 | $153,700 |
| 2013 | $6,707 | $293,900 | $140,200 | $153,700 |
Source: Public Records
Map
Nearby Homes
- 4-13 Woodmont Dr
- 77 Mooar Hill Rd
- 172 Hayden Rd
- 102 Silver Lake Rd
- 3 Wood Ln
- 16 Captain Danforth Ln
- 25 Eastern Ave
- 6 Veterans Rd Unit 15
- 40-40A Pine Hill Rd
- 8 Carriage Ln
- 8 Pilgrim Cir
- 77 Broad St
- 118 Broad St
- 36 Berkeley Place
- 686 Route 13 S
- 2 Ninth St
- 199 Pine Hill Rd
- 303 Route 13
- 8 Colburn Rd
- 00 Ruonala Rd