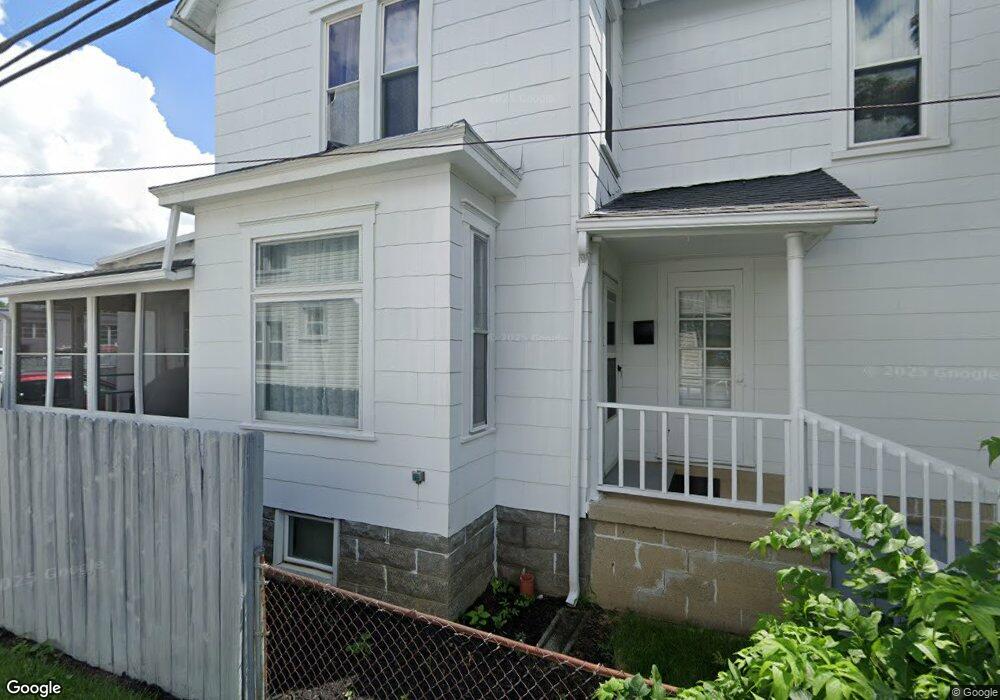
18 W Pacemont Rd Columbus, OH 43202
Clintonville NeighborhoodEstimated Value: $485,000 - $705,000
3
Beds
2
Baths
2,546
Sq Ft
$232/Sq Ft
Est. Value
About This Home
This home is located at 18 W Pacemont Rd, Columbus, OH 43202 and is currently estimated at $589,422, approximately $231 per square foot. 18 W Pacemont Rd is a home located in Franklin County with nearby schools including Clinton Elementary School, Dominion Middle School, and Whetstone High School.
Ownership History
Date
Name
Owned For
Owner Type
Purchase Details
Closed on
Aug 16, 2002
Sold by
Brzoska Elizabeth L and Brzoska Elizabeth L
Bought by
Palmo Alexander K and Palmo Elizabeth L
Current Estimated Value
Home Financials for this Owner
Home Financials are based on the most recent Mortgage that was taken out on this home.
Original Mortgage
$133,900
Interest Rate
6.63%
Purchase Details
Closed on
Jan 29, 1999
Sold by
Brzoska Ronald C
Bought by
Brzoska Elizabeth L
Purchase Details
Closed on
Jan 31, 1997
Sold by
Rosselet John W
Bought by
Brzoska Elizabeth L and Brzoska Ronald C
Home Financials for this Owner
Home Financials are based on the most recent Mortgage that was taken out on this home.
Original Mortgage
$130,150
Interest Rate
7.81%
Mortgage Type
New Conventional
Create a Home Valuation Report for This Property
The Home Valuation Report is an in-depth analysis detailing your home's value as well as a comparison with similar homes in the area
Home Values in the Area
Average Home Value in this Area
Purchase History
| Date | Buyer | Sale Price | Title Company |
|---|---|---|---|
| Palmo Alexander K | -- | -- | |
| Brzoska Elizabeth L | -- | -- | |
| Brzoska Elizabeth L | $137,000 | -- |
Source: Public Records
Mortgage History
| Date | Status | Borrower | Loan Amount |
|---|---|---|---|
| Closed | Palmo Alexander K | $133,900 | |
| Closed | Brzoska Elizabeth L | $130,150 |
Source: Public Records
Tax History
| Year | Tax Paid | Tax Assessment Tax Assessment Total Assessment is a certain percentage of the fair market value that is determined by local assessors to be the total taxable value of land and additions on the property. | Land | Improvement |
|---|---|---|---|---|
| 2025 | $7,467 | $166,390 | $42,070 | $124,320 |
| 2024 | $7,467 | $166,390 | $42,070 | $124,320 |
| 2023 | $7,372 | $166,390 | $42,070 | $124,320 |
| 2022 | $7,657 | $147,630 | $31,080 | $116,550 |
| 2021 | $7,670 | $147,630 | $31,080 | $116,550 |
| 2020 | $7,680 | $147,630 | $31,080 | $116,550 |
| 2019 | $7,300 | $120,340 | $23,910 | $96,430 |
| 2018 | $6,353 | $120,340 | $23,910 | $96,430 |
| 2017 | $6,634 | $120,340 | $23,910 | $96,430 |
| 2016 | $5,972 | $90,160 | $20,580 | $69,580 |
| 2015 | $5,422 | $90,160 | $20,580 | $69,580 |
| 2014 | $5,435 | $90,160 | $20,580 | $69,580 |
| 2013 | $2,651 | $89,180 | $19,600 | $69,580 |
Source: Public Records
Map
Nearby Homes
- 45 E California Ave
- 94 W Tulane Rd
- 84-86 W Como Ave
- 99 E Pacemont Rd
- 123 W Como Ave
- 3021 N High St
- 83 Clinton Heights Ave
- 231 W Pacemont Rd Unit 235
- 270 Clinton Heights Ave
- 296 Walhalla Rd
- 196 W North Broadway St
- 27 E Dunedin Rd
- 107 E Dunedin Rd
- 222 W North Broadway St
- 263 W North Broadway St
- 53 Olentangy St
- 30 E Torrence Rd
- 2683 Neil Ave Unit 685
- 109 E Arcadia Ave
- 2717 Hibbert Ave
- 18 W Pacemont Rd
- 24 W Pacemont Rd Unit 26
- 14 1/2 W Pacemont Rd
- 32 W Pacemont Rd
- 3167 N High St Unit 1
- 38 W Pacemont Rd
- 29 W Pacemont Rd Unit 31
- 25 W Lakeview Ave
- 44 W Pacemont Rd
- 35 W Pacemont Rd Unit 37
- 29 W Lakeview Ave
- 3143 N High St Unit 145
- 3143-3145 N High St
- 47 W Pacemont Rd
- 52 W Pacemont Rd
- 35 W Lakeview Ave
- 45-47 W Pacemont Rd
- 49-51 W Pacemont Rd
- 30 W California Ave
- 49 W Pacemont Rd Unit 51
Your Personal Tour Guide
Ask me questions while you tour the home.