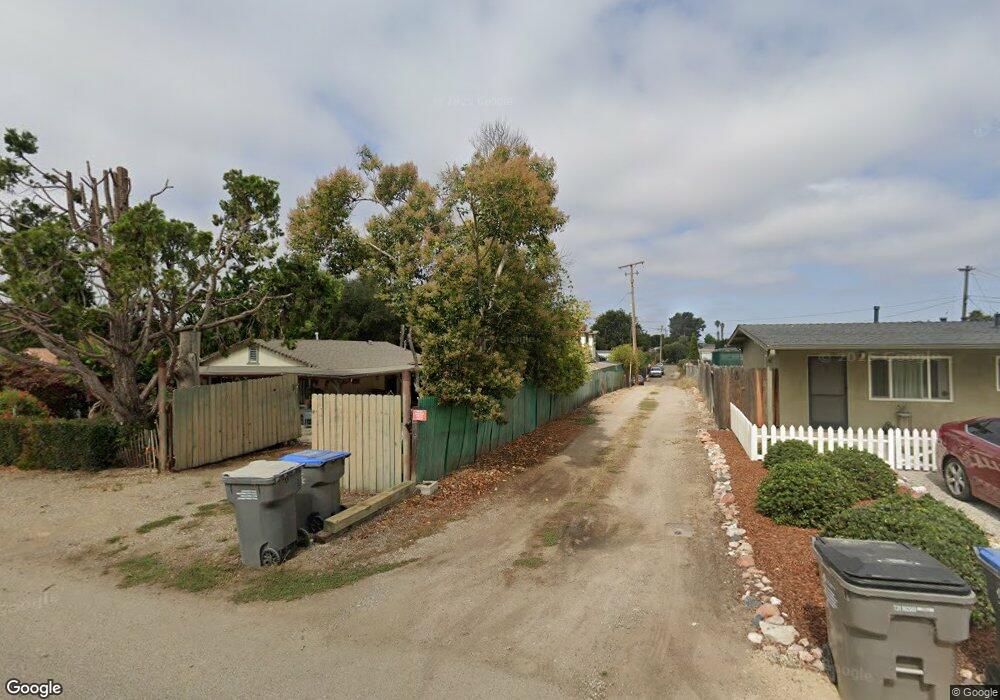
180 Bee St Nipomo, CA 93444
Estimated Value: $785,000 - $886,537
5
Beds
4
Baths
2,777
Sq Ft
$303/Sq Ft
Est. Value
About This Home
This home is located at 180 Bee St, Nipomo, CA 93444 and is currently estimated at $842,634, approximately $303 per square foot. 180 Bee St is a home located in San Luis Obispo County with nearby schools including Nipomo Elementary School, Mesa Middle School, and Nipomo High School.
Ownership History
Date
Name
Owned For
Owner Type
Purchase Details
Closed on
Aug 4, 2008
Sold by
The John & Susan Reynoso Family Trust and Reynoso John
Bought by
Reynoso John and Susan Reynoso A
Current Estimated Value
Home Financials for this Owner
Home Financials are based on the most recent Mortgage that was taken out on this home.
Original Mortgage
$417,000
Outstanding Balance
$273,554
Interest Rate
6.32%
Mortgage Type
New Conventional
Estimated Equity
$569,080
Purchase Details
Closed on
Apr 6, 2007
Sold by
Reynoso Johnnie F and Reynoso Nora
Bought by
Reynoso John and Susan Reynoso A
Purchase Details
Closed on
Jul 26, 2006
Sold by
Reynoso Johnnie F
Bought by
Reynoso Johnnie F and Reynoso Nora
Home Financials for this Owner
Home Financials are based on the most recent Mortgage that was taken out on this home.
Original Mortgage
$415,000
Interest Rate
7.37%
Mortgage Type
New Conventional
Purchase Details
Closed on
Apr 8, 2005
Sold by
Reynoso John F
Bought by
Reynoso John and Susan Reynoso A
Purchase Details
Closed on
Jan 26, 2005
Sold by
Reynoso Nora
Bought by
Reynoso John F
Home Financials for this Owner
Home Financials are based on the most recent Mortgage that was taken out on this home.
Original Mortgage
$360,000
Interest Rate
8.75%
Mortgage Type
Purchase Money Mortgage
Purchase Details
Closed on
May 24, 2004
Sold by
Reynoso John F and Reynoso Nora
Bought by
Reynoso John and Susan Reynoso A
Home Financials for this Owner
Home Financials are based on the most recent Mortgage that was taken out on this home.
Original Mortgage
$150,000
Interest Rate
5.35%
Mortgage Type
New Conventional
Purchase Details
Closed on
Apr 6, 2004
Sold by
Reynoso John and Susan Reynoso A
Bought by
Reynoso John F and Reynoso Nora A
Home Financials for this Owner
Home Financials are based on the most recent Mortgage that was taken out on this home.
Original Mortgage
$150,000
Interest Rate
5.35%
Mortgage Type
New Conventional
Purchase Details
Closed on
Aug 29, 1996
Sold by
Reynoso Johnnie F
Bought by
Reynoso John and Susan Reynoso A
Create a Home Valuation Report for This Property
The Home Valuation Report is an in-depth analysis detailing your home's value as well as a comparison with similar homes in the area
Home Values in the Area
Average Home Value in this Area
Purchase History
| Date | Buyer | Sale Price | Title Company |
|---|---|---|---|
| Reynoso John | -- | Chicago Title | |
| Reynoso John | -- | None Available | |
| Reynoso Johnnie F | -- | None Available | |
| Reynoso John | -- | First American Title Co | |
| Reynoso John F | -- | First American Title Company | |
| Reynoso John F | -- | First American Title Company | |
| Reynoso John | -- | -- | |
| Reynoso John F | -- | First American Title Company | |
| Reynoso John | -- | -- |
Source: Public Records
Mortgage History
| Date | Status | Borrower | Loan Amount |
|---|---|---|---|
| Open | Reynoso John | $417,000 | |
| Previous Owner | Reynoso Johnnie F | $415,000 | |
| Previous Owner | Reynoso John F | $360,000 | |
| Previous Owner | Reynoso John F | $150,000 |
Source: Public Records
Tax History Compared to Growth
Tax History
| Year | Tax Paid | Tax Assessment Tax Assessment Total Assessment is a certain percentage of the fair market value that is determined by local assessors to be the total taxable value of land and additions on the property. | Land | Improvement |
|---|---|---|---|---|
| 2025 | $2,470 | $247,249 | $27,357 | $219,892 |
| 2024 | $2,440 | $242,402 | $26,821 | $215,581 |
| 2023 | $2,440 | $237,650 | $26,296 | $211,354 |
| 2022 | $2,402 | $232,991 | $25,781 | $207,210 |
| 2021 | $2,396 | $228,424 | $25,276 | $203,148 |
| 2020 | $2,368 | $226,082 | $25,017 | $201,065 |
| 2019 | $2,352 | $221,650 | $24,527 | $197,123 |
| 2018 | $2,322 | $217,305 | $24,047 | $193,258 |
| 2017 | $2,277 | $213,045 | $23,576 | $189,469 |
| 2016 | $2,146 | $208,868 | $23,114 | $185,754 |
| 2015 | $2,114 | $205,731 | $22,767 | $182,964 |
| 2014 | $2,035 | $201,702 | $22,322 | $179,380 |
Source: Public Records
Map
Nearby Homes
- 1 W Branch St
- 412 N Mallagh St
- 400 N Oakglen Ave
- 150 E Chestnut St
- 189 E Tefft St
- 0 S Burton St
- 90111003 W Price St
- 160 San Antonio Ln
- 285 E Tefft St
- 449 W Tefft St Unit 23
- 449 W Tefft St Unit 13
- 255 Encino Ln
- 525 Grande Ave Unit D
- 228 Chaparral Ln
- 680 Hill St
- Mesa Plan at Hill Street Terraces - Hill Street Series
- Pacific Plan at Hill Street Terraces - Hill Street Series
- Monarch Plan at Hill Street Terraces - Hill Street Series
- Rancho Plan at Hill Street Terraces - Hill Street Series
- Dana Plan at Hill Street Terraces - Hill Street Series
- 304 N Mallagh St
- 260 N Mallagh St
- 160 Bee St
- 308 N Mallagh St
- 246 N Mallagh St
- 283 N Burton St
- 295 N Burton St
- 314 N Mallagh St
- 312 N Mallagh St
- 312 314 Mallagh St
- 267 N Burton St
- 150 Bee St
- 303 N Burton St
- 240 N Mallagh St
- 328 N Mallagh St
- 249 N Burton St
- 311 N Burton St
- 243 N Burton St
- 321 N Burton St