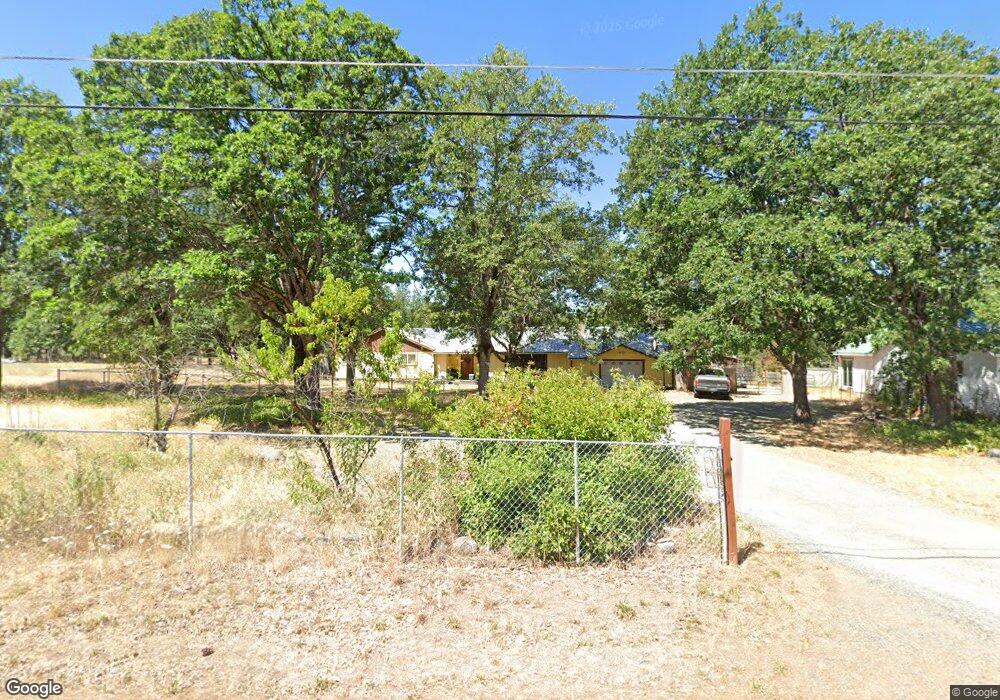
180 Madrone Ave Hayfork, CA 96041
Estimated Value: $156,000 - $203,000
Studio
--
Bath
--
Sq Ft
27,878
Sq Ft Lot
About This Home
This home is located at 180 Madrone Ave, Hayfork, CA 96041 and is currently estimated at $182,679. 180 Madrone Ave is a home with nearby schools including Hayfork High School.
Ownership History
Date
Name
Owned For
Owner Type
Purchase Details
Closed on
Sep 14, 2021
Sold by
Adams Cameron P and Adams Lisa A
Bought by
Thao Tou Kong
Current Estimated Value
Home Financials for this Owner
Home Financials are based on the most recent Mortgage that was taken out on this home.
Original Mortgage
$75,000
Outstanding Balance
$68,244
Interest Rate
2.8%
Mortgage Type
Commercial
Estimated Equity
$114,435
Purchase Details
Closed on
May 17, 2006
Sold by
Stoddard Danny and Stoddard Karen R
Bought by
Adams Cameron P and Adams Lisa A
Home Financials for this Owner
Home Financials are based on the most recent Mortgage that was taken out on this home.
Original Mortgage
$113,500
Interest Rate
6.41%
Mortgage Type
Fannie Mae Freddie Mac
Create a Home Valuation Report for This Property
The Home Valuation Report is an in-depth analysis detailing your home's value as well as a comparison with similar homes in the area
Home Values in the Area
Average Home Value in this Area
Purchase History
| Date | Buyer | Sale Price | Title Company |
|---|---|---|---|
| Thao Tou Kong | $150,000 | Trinity County Title Company | |
| Adams Cameron P | -- | Trinity Co Title Co |
Source: Public Records
Mortgage History
| Date | Status | Borrower | Loan Amount |
|---|---|---|---|
| Open | Thao Tou Kong | $75,000 | |
| Previous Owner | Adams Cameron P | $113,500 |
Source: Public Records
Tax History
| Year | Tax Paid | Tax Assessment Tax Assessment Total Assessment is a certain percentage of the fair market value that is determined by local assessors to be the total taxable value of land and additions on the property. | Land | Improvement |
|---|---|---|---|---|
| 2025 | $2,002 | $159,180 | $53,060 | $106,120 |
| 2024 | $1,966 | $156,060 | $52,020 | $104,040 |
| 2023 | $1,966 | $153,000 | $51,000 | $102,000 |
| 2022 | $1,933 | $150,000 | $50,000 | $100,000 |
| 2021 | $1,235 | $104,344 | $33,439 | $70,905 |
| 2020 | $1,189 | $103,275 | $33,097 | $70,178 |
| 2019 | $1,138 | $101,251 | $32,449 | $68,802 |
| 2018 | $1,138 | $99,266 | $31,813 | $67,453 |
| 2017 | $1,135 | $97,321 | $31,190 | $66,131 |
| 2016 | $1,097 | $95,414 | $30,579 | $64,835 |
| 2015 | $1,083 | $93,982 | $30,120 | $63,862 |
| 2014 | $1,071 | $92,142 | $29,530 | $62,612 |
Source: Public Records
Map
Nearby Homes
Your Personal Tour Guide
Ask me questions while you tour the home.