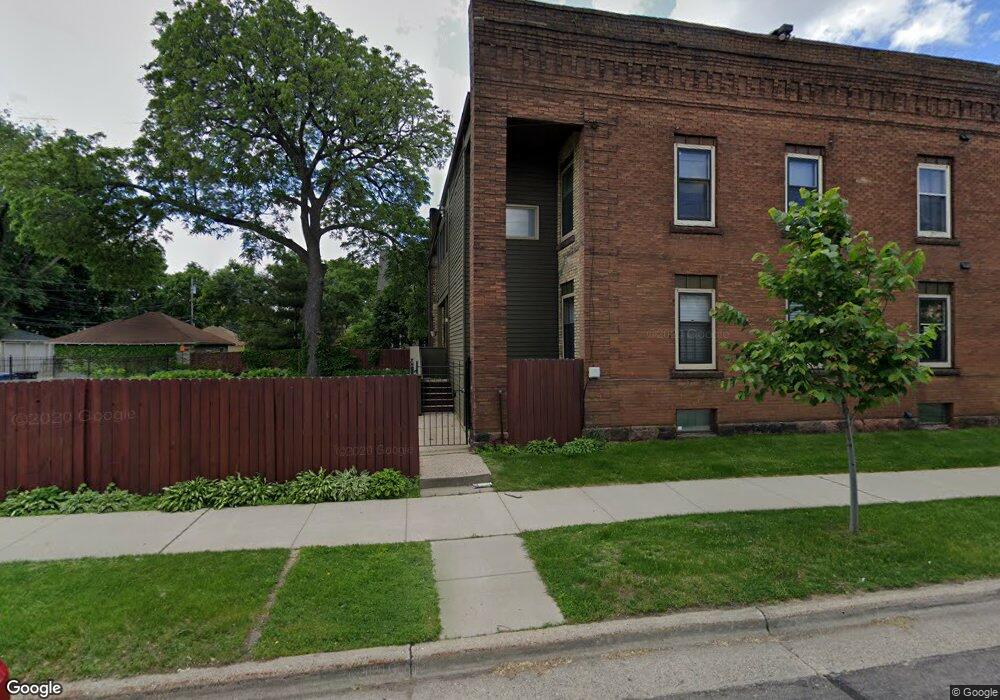
1801 10th Ave S Unit 1 Minneapolis, MN 55404
Ventura Village NeighborhoodEstimated Value: $127,000 - $245,000
2
Beds
1
Bath
1,326
Sq Ft
$130/Sq Ft
Est. Value
About This Home
This home is located at 1801 10th Ave S Unit 1, Minneapolis, MN 55404 and is currently estimated at $172,771, approximately $130 per square foot. 1801 10th Ave S Unit 1 is a home located in Hennepin County with nearby schools including Andersen United Middle School, South Senior High School, and Augsburg Fairview Academy.
Ownership History
Date
Name
Owned For
Owner Type
Purchase Details
Closed on
Aug 12, 2019
Sold by
Iburg Clair and Iburg Lucy
Bought by
Beck Kevin Karroll
Current Estimated Value
Home Financials for this Owner
Home Financials are based on the most recent Mortgage that was taken out on this home.
Original Mortgage
$135,000
Outstanding Balance
$118,235
Interest Rate
3.7%
Mortgage Type
New Conventional
Estimated Equity
$54,536
Purchase Details
Closed on
Apr 22, 2015
Sold by
Wells Fargo Bank National Association
Bought by
Iburg Lucy
Purchase Details
Closed on
Jan 28, 2015
Sold by
Heimer Jeremy
Bought by
Wells Fargo Bank Na
Purchase Details
Closed on
Sep 23, 2003
Sold by
Snelson Keith M
Bought by
Heimer Jeremy
Purchase Details
Closed on
Apr 20, 2001
Sold by
Koplin Michael
Bought by
Snelson Keith M
Purchase Details
Closed on
Oct 28, 1999
Sold by
Good Gene D
Bought by
Koplin Michael K and Koplin Ann Perron
Create a Home Valuation Report for This Property
The Home Valuation Report is an in-depth analysis detailing your home's value as well as a comparison with similar homes in the area
Home Values in the Area
Average Home Value in this Area
Purchase History
| Date | Buyer | Sale Price | Title Company |
|---|---|---|---|
| Beck Kevin Karroll | $180,000 | Titlesmart Inc | |
| Iburg Lucy | $71,925 | Title365 | |
| Wells Fargo Bank Na | $125,679 | None Available | |
| Heimer Jeremy | $107,000 | -- | |
| Snelson Keith M | $78,700 | -- | |
| Koplin Michael K | $31,453 | -- |
Source: Public Records
Mortgage History
| Date | Status | Borrower | Loan Amount |
|---|---|---|---|
| Open | Beck Kevin Karroll | $135,000 |
Source: Public Records
Tax History Compared to Growth
Tax History
| Year | Tax Paid | Tax Assessment Tax Assessment Total Assessment is a certain percentage of the fair market value that is determined by local assessors to be the total taxable value of land and additions on the property. | Land | Improvement |
|---|---|---|---|---|
| 2024 | $2,186 | $147,000 | $13,000 | $134,000 |
| 2023 | $2,128 | $163,000 | $9,400 | $153,600 |
| 2022 | $2,217 | $163,000 | $9,400 | $153,600 |
| 2021 | $1,846 | $160,000 | $9,400 | $150,600 |
| 2020 | $1,739 | $138,000 | $9,400 | $128,600 |
| 2019 | $1,687 | $120,000 | $9,400 | $110,600 |
| 2018 | $1,585 | $113,000 | $9,400 | $103,600 |
| 2017 | $1,540 | $100,000 | $9,400 | $90,600 |
| 2016 | $1,296 | $81,500 | $9,400 | $72,100 |
| 2015 | $1,361 | $81,500 | $9,400 | $72,100 |
| 2014 | -- | $81,500 | $9,400 | $72,100 |
Source: Public Records
Map
Nearby Homes
- 1801 Elliot Ave Unit 4 and 6
- 1801 Elliot Ave Unit 5
- 1009 E 19th St
- 1916 Elliot Ave
- 1604 Elliot Ave
- 1517 11th Ave S
- 1520 Elliot Ave Unit 1
- 1520 Elliot Ave Unit 4
- 1509 11th Ave S
- 1912 Columbus Ave
- 2512 13th Ave S
- 1829 Park Ave Unit 7
- 1106 E 22nd St
- 1601 Park Ave
- 2221 Elliot Ave
- 628 E Franklin Ave Unit 100
- 628 E Franklin Ave Unit 301
- 1318 E 23rd St
- 2122 Oakland Ave
- 2428 11th Ave S
- 1801 1/2 10th Ave S Unit 6
- 1807 10th Ave S Unit 4
- 1805 10th Ave S
- 1803 10th Ave S
- 1801 10th Ave S Unit 1801 10th Ave.
- 1805 1/2 10th Ave S
- 1803 1/2 10th Ave S
- 1805 1/2 10th Ave S Unit 2
- 1803 1/2 10th Ave S Unit 5
- 1809 10th Ave S
- 1811 10th Ave S
- 1815 10th Ave S Unit 3
- 1815 10th Ave S
- 1815 10th Ave S Unit 2
- 1815 10th Ave S Unit 4
- 1815 10th Ave S
- 1806 11th Ave S
- 1800 1800 10th Ave S
- 1802 1802 10th-Avenue-s
- 1802 1802 10th Ave S