1801 10th St Manhattan Beach, CA 90266
Estimated Value: $3,301,000 - $4,176,000
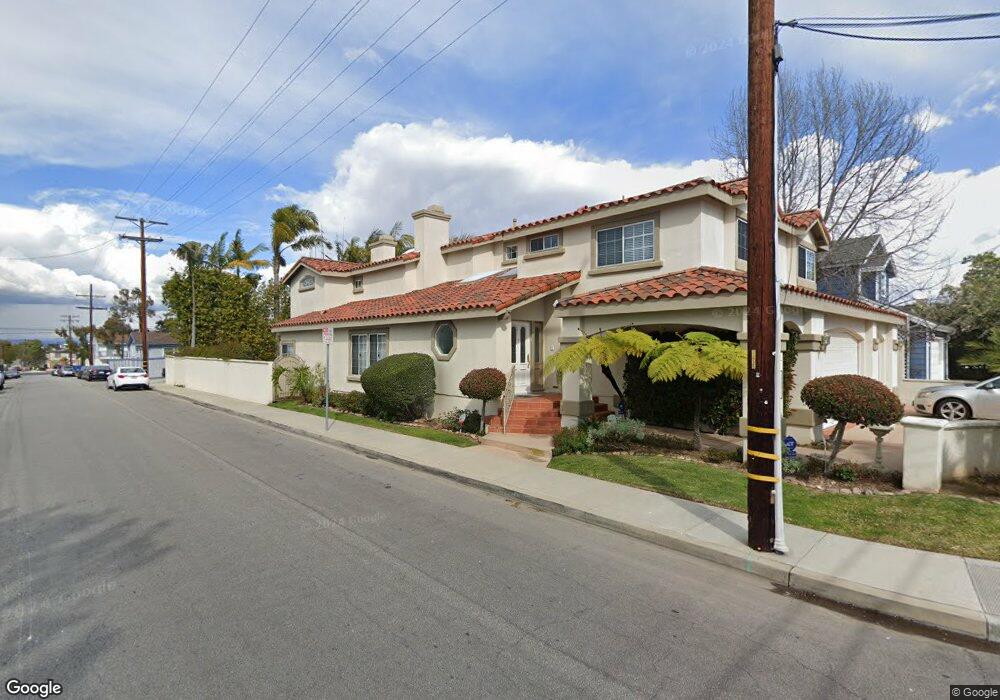
About This Home
This home is located at 1801 10th St, Manhattan Beach, CA 90266 and is currently estimated at $3,572,205, approximately $859 per square foot. 1801 10th St is a home located in Los Angeles County with nearby schools including Aurelia Pennekamp Elementary School, Manhattan Beach Middle School, and Mira Costa High School.
Ownership History
We collect this data history from publicly available records. To have your information removed, we recommend requesting removal directly through your county’s website.
Purchase Details
Home Financials for this Owner
Home Financials are based on the most recent Mortgage that was taken out on this home.Purchase Details
Purchase Details
Home Financials for this Owner
Home Financials are based on the most recent Mortgage that was taken out on this home.Purchase Details
Home Financials for this Owner
Home Financials are based on the most recent Mortgage that was taken out on this home.Purchase Details
Home Financials for this Owner
Home Financials are based on the most recent Mortgage that was taken out on this home.Purchase Details
Home Financials for this Owner
Home Financials are based on the most recent Mortgage that was taken out on this home.Purchase Details
Home Financials for this Owner
Home Financials are based on the most recent Mortgage that was taken out on this home.Purchase Details
Home Financials for this Owner
Home Financials are based on the most recent Mortgage that was taken out on this home.Purchase Details
Home Financials for this Owner
Home Financials are based on the most recent Mortgage that was taken out on this home.Purchase Details
Purchase Details
Home Financials for this Owner
Home Financials are based on the most recent Mortgage that was taken out on this home.Purchase Details
Home Financials for this Owner
Home Financials are based on the most recent Mortgage that was taken out on this home.Purchase Details
Home Values in the Area
Average Home Value in this Area
Purchase History
We collect this data history from publicly available records. To have your information removed, we recommend requesting removal directly through your county’s website.
| Date | Buyer | Sale Price | Title Company |
|---|---|---|---|
| -- | None Listed On Document | ||
| -- | North American Title | ||
| -- | North American Title Company | ||
| -- | North American Title Co | ||
| -- | None Available | ||
| -- | Chicago Title Inland Empire | ||
| -- | Chicago Title Inland Empire | ||
| -- | Chicago Title Inland Empire | ||
| -- | Fidelity National Title | ||
| -- | Fidelity National Title Co | ||
| -- | None Available | ||
| -- | Fidelity National Title Co | ||
| -- | None Available | ||
| -- | Fidelity National Title Co | ||
| -- | Fidelity National Title Co | ||
| -- | Fidelity Title | ||
| -- | Fidelity National Title Co | ||
| -- | -- |
Mortgage History
We collect this data history from publicly available records. To have your information removed, we recommend requesting removal directly through your county’s website.
| Date | Status | Borrower | Loan Amount |
|---|---|---|---|
| Open | $550,000 | ||
| Previous Owner | $450,000 | ||
| Previous Owner | $408,400 | ||
| Previous Owner | $413,000 | ||
| Previous Owner | $417,000 | ||
| Previous Owner | $417,000 | ||
| Previous Owner | $562,800 | ||
| Previous Owner | $563,700 |
Tax History
We collect this data history from publicly available records. To have your information removed, we recommend requesting removal directly through your county’s website.
| Year | Tax Paid | Tax Assessment Tax Assessment Total Assessment is a certain percentage of the fair market value that is determined by local assessors to be the total taxable value of land and additions on the property. | Land | Improvement |
|---|---|---|---|---|
| 2025 | $14,779 | $1,269,906 | $707,685 | $562,221 |
| 2024 | $14,552 | $1,245,007 | $693,809 | $551,198 |
| 2023 | $14,056 | $1,220,596 | $680,205 | $540,391 |
| 2022 | $13,814 | $1,196,664 | $666,868 | $529,796 |
| 2021 | $13,809 | $1,173,201 | $653,793 | $519,408 |
| 2020 | $13,682 | $1,161,173 | $647,090 | $514,083 |
| 2019 | $13,444 | $1,138,405 | $634,402 | $504,003 |
| 2018 | $13,112 | $1,116,084 | $621,963 | $494,121 |
| 2016 | $12,075 | $1,072,747 | $597,812 | $474,935 |
| 2015 | $11,828 | $1,056,635 | $588,833 | $467,802 |
| 2014 | $11,669 | $1,035,938 | $577,299 | $458,639 |
Map
- 1827 9th St
- 1823 8th St
- 1806 6th St
- 1852 6th St
- 3506 Blossom Ln Unit C
- 2110 Dufour Ave
- 308 N Herrin St
- 2112 Warfield Ave Unit 9
- 1456 Manhattan Beach Blvd Unit C
- 2120 Dufour Ave Unit 16
- 2120 Dufour Ave Unit 6
- 1450 Manhattan Beach Blvd
- 1625 18th St
- 1447 Manhattan Beach Blvd Unit A
- 2000 Robinson St
- 2004 Faymont Ave
- 2009 Graham Ave Unit 2
- 1626 1st St
- 1417 Manhattan Beach Blvd
- 1923 Gates Ave
Ask me questions while you tour the home.