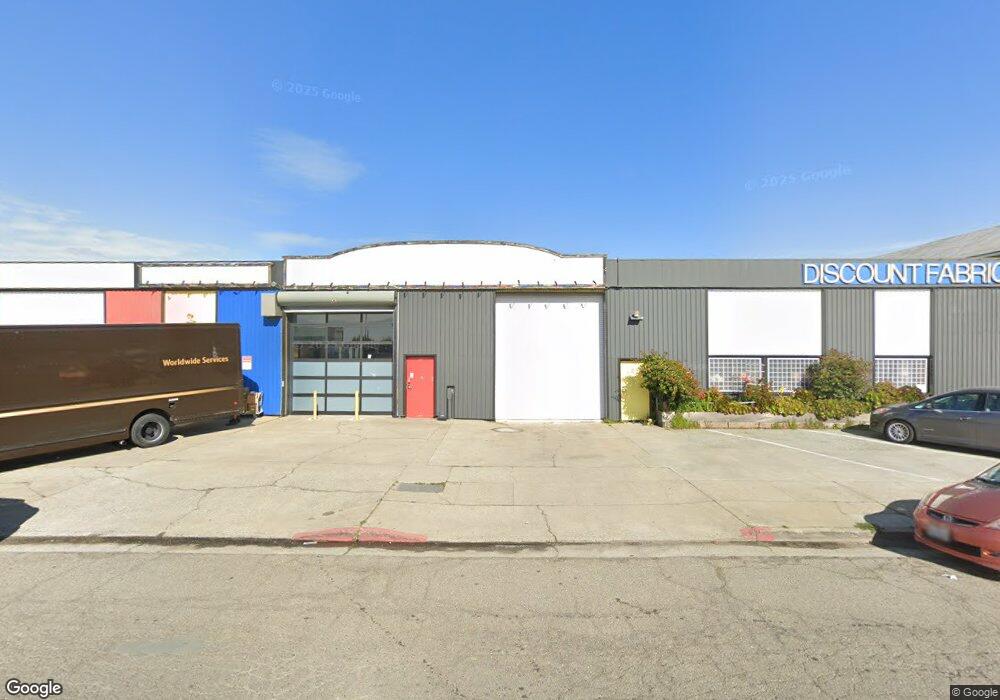
1801 Eastshore Hwy Berkeley, CA 94710
West Berkeley Neighborhood
--
Bed
3
Baths
10,000
Sq Ft
21,000
Acres
About This Home
This home is located at 1801 Eastshore Hwy, Berkeley, CA 94710. 1801 Eastshore Hwy is a home located in Alameda County with nearby schools including Rosa Parks Elementary School, Ruth Acty Elementary, and Berkeley Arts Magnet at Whittier School.
Ownership History
Date
Name
Owned For
Owner Type
Purchase Details
Closed on
Oct 9, 2020
Sold by
Yazdi Allen H
Bought by
Yazdi Allen H
Home Financials for this Owner
Home Financials are based on the most recent Mortgage that was taken out on this home.
Original Mortgage
$800,000
Outstanding Balance
$711,557
Interest Rate
2.9%
Mortgage Type
Commercial
Purchase Details
Closed on
Jul 27, 2017
Sold by
1801 Eastshore Llc
Bought by
Yazdi Allen H
Home Financials for this Owner
Home Financials are based on the most recent Mortgage that was taken out on this home.
Original Mortgage
$1,905,000
Outstanding Balance
$1,586,132
Interest Rate
3.88%
Mortgage Type
Commercial
Purchase Details
Closed on
May 24, 2004
Sold by
Steffco Builders Inc
Bought by
Decarion William R
Home Financials for this Owner
Home Financials are based on the most recent Mortgage that was taken out on this home.
Original Mortgage
$1,350,000
Interest Rate
5.86%
Mortgage Type
Seller Take Back
Create a Home Valuation Report for This Property
The Home Valuation Report is an in-depth analysis detailing your home's value as well as a comparison with similar homes in the area
Home Values in the Area
Average Home Value in this Area
Purchase History
| Date | Buyer | Sale Price | Title Company |
|---|---|---|---|
| Yazdi Allen H | -- | North American Title | |
| Yazdi Allen H | $4,233,000 | Chicago Title Company | |
| Decarion William R | $2,000,000 | Chicago Title Company |
Source: Public Records
Mortgage History
| Date | Status | Borrower | Loan Amount |
|---|---|---|---|
| Open | Yazdi Allen H | $800,000 | |
| Open | Yazdi Allen H | $1,905,000 | |
| Previous Owner | Decarion William R | $1,350,000 |
Source: Public Records
Tax History Compared to Growth
Tax History
| Year | Tax Paid | Tax Assessment Tax Assessment Total Assessment is a certain percentage of the fair market value that is determined by local assessors to be the total taxable value of land and additions on the property. | Land | Improvement |
|---|---|---|---|---|
| 2025 | $41,624 | $2,248,311 | $671,307 | $1,577,004 |
| 2024 | $41,624 | $2,204,228 | $658,145 | $1,546,083 |
| 2023 | $40,699 | $2,161,012 | $645,241 | $1,515,771 |
| 2022 | $39,799 | $2,118,647 | $632,592 | $1,486,055 |
| 2021 | $39,739 | $2,077,111 | $620,190 | $1,456,921 |
| 2020 | $37,162 | $2,055,830 | $613,836 | $1,441,994 |
| 2019 | $35,575 | $2,015,520 | $601,800 | $1,413,720 |
| 2018 | $34,871 | $1,976,000 | $590,000 | $1,386,000 |
| 2017 | $24,715 | $1,200,980 | $360,294 | $840,686 |
| 2016 | $24,747 | $1,177,440 | $353,232 | $824,208 |
| 2015 | $24,333 | $1,159,760 | $347,928 | $811,832 |
| 2014 | $24,007 | $1,137,050 | $341,115 | $795,935 |
Source: Public Records
Map
Nearby Homes
- 817 Delaware St
- 1914 7th St Unit B
- 1450 Fourth St Unit 5
- 817 Jones St
- 1050 Allston Way
- 1011 Delaware St
- 2220 7th St
- 0 Camelia St Unit 41104882
- 1642 10th St
- 1009 Addison St
- 1607 10th St
- 739 Channing Way
- 2310 Eighth St
- 1128 Delaware St
- 2413 7th St
- 1728 Curtis St
- 1919 Curtis St
- 1209 Hearst Ave
- 2406 10th St
- 2220 Browning St
- 1805 Eastshore Hwy
- 1832 2nd St
- 1808 Fifth St
- 2013 2nd St
- 1820 5th St
- 1818 Fifth St
- 1824 5th St
- 1830 5th St
- 1801 5th St Unit 30
- 651 Addison St
- 1645 4th St
- 731 Virginia St
- 819 Delaware St
- 821 Delaware St
- 803 Delaware St
- 820 Delaware St
- 802 Delaware St
- 803 Delaware St Unit 4-10
- 803 Delaware St
- 803 Delaware St