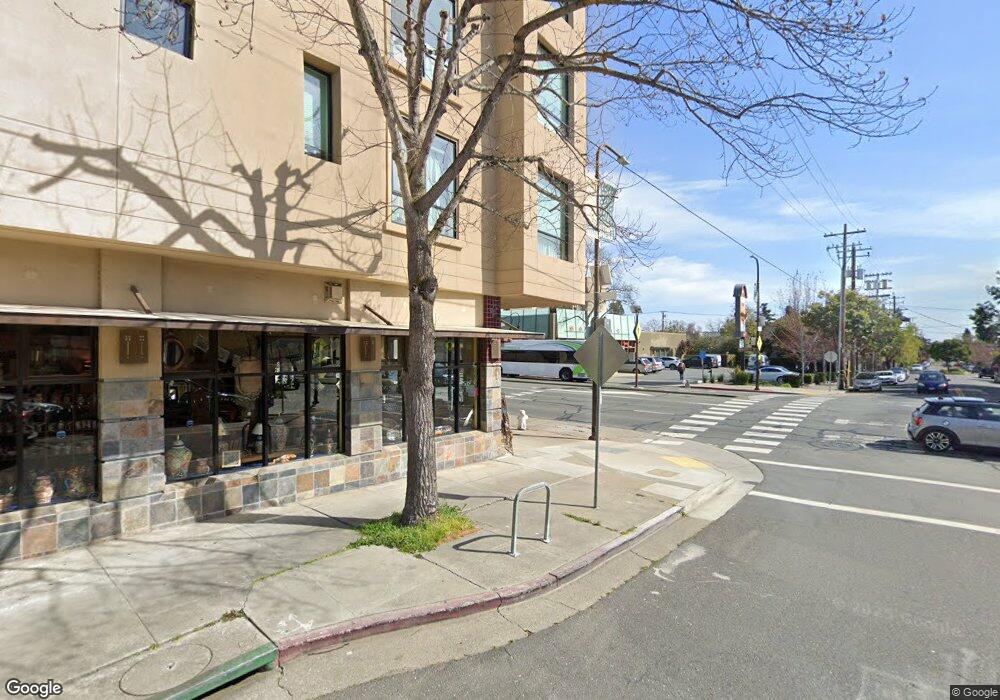
1801 University Ave Unit 405 Berkeley, CA 94703
Downtown Berkeley NeighborhoodEstimated Value: $644,000 - $813,000
1
Bed
1
Bath
620
Sq Ft
$1,201/Sq Ft
Est. Value
About This Home
This home is located at 1801 University Ave Unit 405, Berkeley, CA 94703 and is currently estimated at $744,683, approximately $1,201 per square foot. 1801 University Ave Unit 405 is a home located in Alameda County with nearby schools including Washington Elementary School, Berkeley Arts Magnet at Whittier School, and Oxford Elementary School.
Ownership History
Date
Name
Owned For
Owner Type
Purchase Details
Closed on
Sep 13, 2005
Sold by
Fairles Russell T and Fairles Nina Kollmar
Bought by
Swanson Linda L
Current Estimated Value
Home Financials for this Owner
Home Financials are based on the most recent Mortgage that was taken out on this home.
Original Mortgage
$150,000
Outstanding Balance
$80,049
Interest Rate
5.81%
Mortgage Type
Fannie Mae Freddie Mac
Estimated Equity
$664,634
Purchase Details
Closed on
May 13, 1998
Sold by
University Lofts Lp
Bought by
Fairles Russell T and Kollmar Nina
Home Financials for this Owner
Home Financials are based on the most recent Mortgage that was taken out on this home.
Original Mortgage
$180,000
Interest Rate
7.1%
Create a Home Valuation Report for This Property
The Home Valuation Report is an in-depth analysis detailing your home's value as well as a comparison with similar homes in the area
Home Values in the Area
Average Home Value in this Area
Purchase History
| Date | Buyer | Sale Price | Title Company |
|---|---|---|---|
| Swanson Linda L | $500,000 | -- | |
| Fairles Russell T | $205,000 | Old Republic Title Company |
Source: Public Records
Mortgage History
| Date | Status | Borrower | Loan Amount |
|---|---|---|---|
| Open | Swanson Linda L | $150,000 | |
| Previous Owner | Fairles Russell T | $180,000 |
Source: Public Records
Tax History
| Year | Tax Paid | Tax Assessment Tax Assessment Total Assessment is a certain percentage of the fair market value that is determined by local assessors to be the total taxable value of land and additions on the property. | Land | Improvement |
|---|---|---|---|---|
| 2025 | $10,855 | $676,230 | $204,969 | $478,261 |
| 2024 | $10,855 | $662,834 | $200,950 | $468,884 |
| 2023 | $10,621 | $656,704 | $197,011 | $459,693 |
| 2022 | $10,422 | $636,830 | $193,149 | $450,681 |
| 2021 | $10,436 | $624,210 | $189,363 | $441,847 |
| 2020 | $9,863 | $624,740 | $187,422 | $437,318 |
| 2019 | $8,701 | $550,000 | $165,000 | $385,000 |
| 2018 | $8,375 | $525,000 | $157,500 | $367,500 |
| 2017 | $8,203 | $525,000 | $157,500 | $367,500 |
| 2016 | $7,736 | $500,000 | $150,000 | $350,000 |
| 2015 | $6,705 | $430,000 | $129,000 | $301,000 |
| 2014 | $6,001 | $370,000 | $111,000 | $259,000 |
Source: Public Records
Map
Nearby Homes
- 2218 -2222 Grant St
- 2118 California St
- 1625 Martin Luther King jr Way
- 1813 Sacramento St
- 1808 Cedar St
- 1609 Bonita Ave Unit 5
- 1610 Milvia St
- 1411 Hearst Ave Unit 2
- 1815 Vine St
- 1564 Sacramento St
- 1682 Oxford St
- 2201 Virginia St Unit 2
- 1425 Martin Luther King jr Way
- 1739 Spruce St
- 1645 Dwight Way
- 2350 Sacramento St
- 1408 Henry St
- 1322 Virginia St
- 1444 Walnut St
- 1519 Oxford St Unit E
- 1801 University Ave Unit 209
- 1801 University Ave Unit 408
- 1801 University Ave Unit 308
- 1801 University Ave Unit 208
- 1801 University Ave Unit 407
- 1801 University Ave Unit 307
- 1801 University Ave Unit 207
- 1801 University Ave Unit 406
- 1801 University Ave Unit 306
- 1801 University Ave Unit 206
- 1801 University Ave Unit 305
- 1801 University Ave Unit 205
- 1801 University Ave Unit 404
- 1801 University Ave Unit 304
- 1801 University Ave Unit 204
- 1801 University Ave Unit 403
- 1801 University Ave Unit 303
- 1801 University Ave Unit 203
- 1801 University Ave Unit 402
- 1801 University Ave Unit 302
Your Personal Tour Guide
Ask me questions while you tour the home.