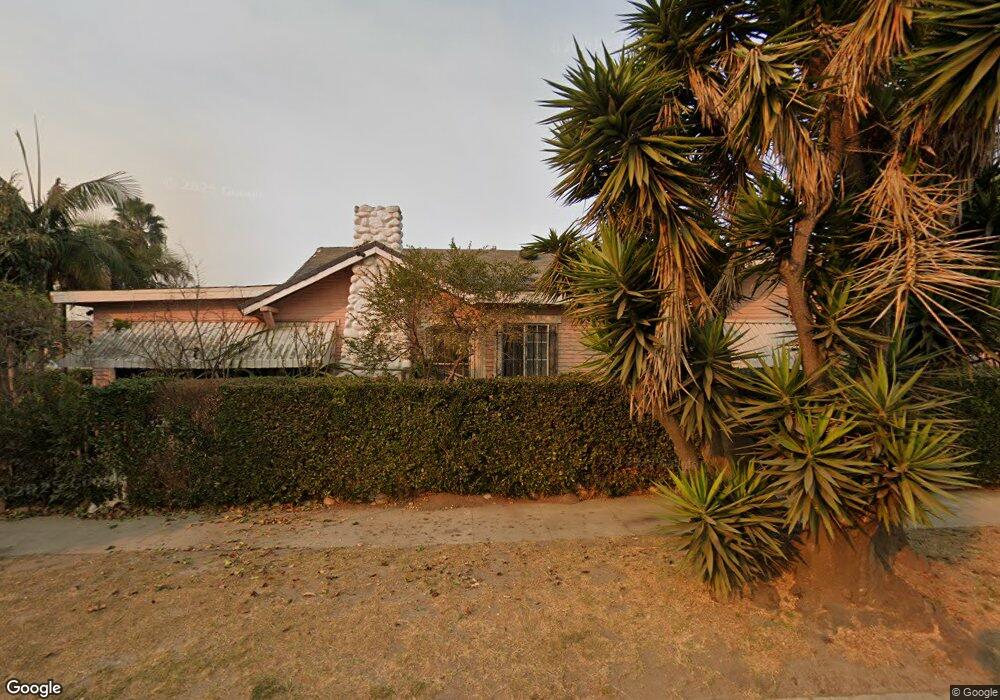
1801 W 41st St Los Angeles, CA 90062
Vermont Square NeighborhoodEstimated Value: $832,000 - $1,025,007
3
Beds
1
Bath
2,120
Sq Ft
$451/Sq Ft
Est. Value
About This Home
This home is located at 1801 W 41st St, Los Angeles, CA 90062 and is currently estimated at $956,502, approximately $451 per square foot. 1801 W 41st St is a home located in Los Angeles County with nearby schools including Martin Luther King Jr. Elementary School, Barack Obama Global Preparation Academy, and Crenshaw Science, Technology, Engineering, Math And Medicine Magnet.
Ownership History
Date
Name
Owned For
Owner Type
Purchase Details
Closed on
Oct 19, 2006
Sold by
Balcorta Paul Anthony
Bought by
Mejia Jose Roberto Velasco
Current Estimated Value
Home Financials for this Owner
Home Financials are based on the most recent Mortgage that was taken out on this home.
Original Mortgage
$415,200
Outstanding Balance
$248,305
Interest Rate
6.5%
Mortgage Type
Purchase Money Mortgage
Estimated Equity
$708,197
Purchase Details
Closed on
Jul 19, 2001
Sold by
Mckenzie Venora Y
Bought by
Balcorta Paul Anthony and Balcorta Sakkinah Yoba
Home Financials for this Owner
Home Financials are based on the most recent Mortgage that was taken out on this home.
Original Mortgage
$85,500
Interest Rate
6%
Mortgage Type
Seller Take Back
Purchase Details
Closed on
Nov 11, 1999
Sold by
Trust Mitchell, Marinna Tr Marianna Mitch
Bought by
Mckenzie Venora Y
Purchase Details
Closed on
Feb 1, 1995
Sold by
Mitchell Marianna
Bought by
Mitchell Marinna and Mckenzie Venora Y
Create a Home Valuation Report for This Property
The Home Valuation Report is an in-depth analysis detailing your home's value as well as a comparison with similar homes in the area
Home Values in the Area
Average Home Value in this Area
Purchase History
| Date | Buyer | Sale Price | Title Company |
|---|---|---|---|
| Mejia Jose Roberto Velasco | $519,000 | Ticor Title Company | |
| Balcorta Paul Anthony | $85,500 | -- | |
| Mckenzie Venora Y | -- | -- | |
| Mitchell Marinna | -- | -- |
Source: Public Records
Mortgage History
| Date | Status | Borrower | Loan Amount |
|---|---|---|---|
| Open | Mejia Jose Roberto Velasco | $415,200 | |
| Previous Owner | Balcorta Paul Anthony | $85,500 |
Source: Public Records
Tax History Compared to Growth
Tax History
| Year | Tax Paid | Tax Assessment Tax Assessment Total Assessment is a certain percentage of the fair market value that is determined by local assessors to be the total taxable value of land and additions on the property. | Land | Improvement |
|---|---|---|---|---|
| 2025 | $8,543 | $695,334 | $556,273 | $139,061 |
| 2024 | $8,543 | $681,701 | $545,366 | $136,335 |
| 2023 | $8,385 | $668,335 | $534,673 | $133,662 |
| 2022 | $8,004 | $655,232 | $524,190 | $131,042 |
| 2021 | $7,897 | $642,385 | $513,912 | $128,473 |
| 2019 | $7,665 | $623,333 | $498,670 | $124,663 |
| 2018 | $7,581 | $611,112 | $488,893 | $122,219 |
| 2017 | $7,420 | $599,130 | $479,307 | $119,823 |
| 2016 | $7,241 | $587,383 | $469,909 | $117,474 |
| 2015 | $5,759 | $463,000 | $354,200 | $108,800 |
| 2014 | $4,092 | $315,000 | $241,000 | $74,000 |
Source: Public Records
Map
Nearby Homes
- 1758 W 41st St
- 1914 W 41st St
- 1726 Leighton Ave
- 1723 Browning Blvd
- 2015 W 42nd Place
- 1724 W 43rd St
- 4027 La Salle Ave
- 1659 W 39th St
- 3968 Arlington Ave
- 1619 W 39th St
- 3994 La Salle Ave
- 1858 W Vernon Ave
- 1821 Middleton Place
- 5150 S Western Ave
- 2018 W 39th St
- 2025 W Vernon Ave
- 3959 Denker Ave
- 3887 S Van Ness Ave
- 4301 Arlington Ave
- 1800 W 45th St
- 1807 W 41st St
- 1811 W 41st St
- 1763 W 41st St
- 1817 W 41st St
- 1759 W 41st St
- 1821 W 41st St
- 1800 W 41st St
- 1806 W 41st St
- 1753 W 41st St
- 1810 W 41st St
- 1762 W 41st St
- 1825 W 41st St
- 1816 W 41st St
- 1820 W Mlk Blvd
- 1749 W 41st St
- 1820 W 41st St
- 1824 W Martin Luther King jr Blvd
- 1824 W Mlk Blvd
- 1829 W 41st St
- 1752 W 41st St