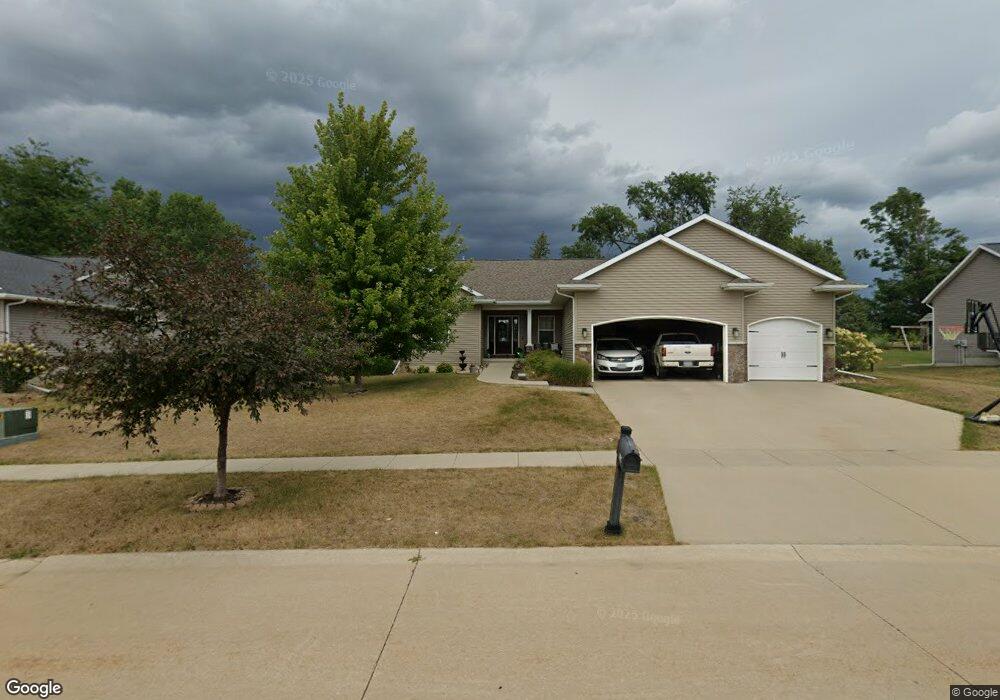
1802 Hoover Trail Ct SW Cedar Rapids, IA 52404
Estimated Value: $400,000 - $480,273
--
Bed
5
Baths
2,065
Sq Ft
$221/Sq Ft
Est. Value
About This Home
This home is located at 1802 Hoover Trail Ct SW, Cedar Rapids, IA 52404 and is currently estimated at $456,068, approximately $220 per square foot. 1802 Hoover Trail Ct SW is a home with nearby schools including Prairie Heights Elementary School, Prairie View Elementary School, and Prairie Crest Elementary School.
Ownership History
Date
Name
Owned For
Owner Type
Purchase Details
Closed on
Dec 12, 2019
Sold by
Christensen Troy N and Christensen Karen S
Bought by
Whittlesey Brandon
Current Estimated Value
Home Financials for this Owner
Home Financials are based on the most recent Mortgage that was taken out on this home.
Original Mortgage
$285,175
Outstanding Balance
$251,914
Interest Rate
3.7%
Mortgage Type
New Conventional
Estimated Equity
$204,154
Purchase Details
Closed on
Oct 28, 2011
Sold by
Capital Builders Inc
Bought by
Christensen Troy N and Christensen Karen S
Home Financials for this Owner
Home Financials are based on the most recent Mortgage that was taken out on this home.
Original Mortgage
$235,600
Interest Rate
4.12%
Mortgage Type
New Conventional
Purchase Details
Closed on
Jul 13, 2011
Sold by
Sevig Development Lc
Bought by
Capital Builders Inc
Home Financials for this Owner
Home Financials are based on the most recent Mortgage that was taken out on this home.
Original Mortgage
$244,000
Interest Rate
4.52%
Mortgage Type
New Conventional
Create a Home Valuation Report for This Property
The Home Valuation Report is an in-depth analysis detailing your home's value as well as a comparison with similar homes in the area
Home Values in the Area
Average Home Value in this Area
Purchase History
| Date | Buyer | Sale Price | Title Company |
|---|---|---|---|
| Whittlesey Brandon | $335,500 | None Available | |
| Christensen Troy N | $294,000 | None Available | |
| Capital Builders Inc | $48,500 | None Available |
Source: Public Records
Mortgage History
| Date | Status | Borrower | Loan Amount |
|---|---|---|---|
| Open | Whittlesey Brandon | $285,175 | |
| Previous Owner | Christensen Troy N | $235,600 | |
| Previous Owner | Capital Builders Inc | $244,000 |
Source: Public Records
Tax History Compared to Growth
Tax History
| Year | Tax Paid | Tax Assessment Tax Assessment Total Assessment is a certain percentage of the fair market value that is determined by local assessors to be the total taxable value of land and additions on the property. | Land | Improvement |
|---|---|---|---|---|
| 2025 | $1,982 | $484,000 | $81,400 | $402,600 |
| 2024 | $39 | $482,700 | $81,400 | $401,300 |
| 2023 | $39 | $115,100 | $81,400 | $33,700 |
| 2022 | $7,144 | $345,100 | $74,000 | $271,100 |
| 2021 | $7,380 | $337,700 | $66,600 | $271,100 |
| 2020 | $7,380 | $332,700 | $61,700 | $271,000 |
| 2019 | $6,896 | $316,000 | $54,300 | $261,700 |
| 2018 | $6,296 | $316,000 | $54,300 | $261,700 |
| 2017 | $6,424 | $294,000 | $54,300 | $239,700 |
| 2016 | $6,319 | $292,000 | $47,800 | $244,200 |
| 2015 | $6,337 | $294,488 | $47,770 | $246,718 |
| 2014 | $6,150 | $294,488 | $47,770 | $246,718 |
| 2013 | $5,840 | $294,488 | $47,770 | $246,718 |
Source: Public Records
Map
Nearby Homes
- 5810 Bethpage Cir SW
- 1410 Scarlet Sage Dr SW
- 6614 Scarlet Rose Cir SW
- 1719 Prairie Rose Dr SW
- 6612 Artesa Bell Dr SW
- 7113 Chenango Ln SW
- 6812 Artesa Bell Dr SW
- 7006 Colpepper Dr SW
- Lot 6 College Farms 5th Addition SW
- 5112 Scenic View Ct SW
- Lot 2
- Tbd Old River Rd SW
- 51 Oklahoma Ave SW
- 5655 Deerwood St SW
- 4240 Briar Ridge Ct
- 6620 Preston Terrace Ct SW
- 3728 Sunshine St SW
- 62 Oklahoma Ave SW
- 0 41st Avenue Dr SW Unit 202507355
- 0 41st Avenue Dr SW Unit 1 Ac
- 1808 Hoover Trail Ct SW
- 5908 Ely Rd
- 1503 Hoover Trail Cir SW
- 1509 Hoover Trail Cir SW
- 1706 Hoover Trail Ct SW
- 1814 Hoover Trail Ct SW
- 1515 Hoover Trail Cir SW
- 1700 Hoover Trail Ct SW
- 5900 Ely Rd
- 6203 Hoover Trail Rd SW
- 6204 Hoover Trail Rd SW
- 6201 Fillmore Ct SW
- 1701 Hoover Trail Ct SW
- 1601 Hoover Trail Cir SW
- 6209 Hoover Trail Rd SW
- 1608 Hoover Trail Ct SW
- 6202 Fillmore Ct SW
- 6207 Fillmore Ct SW
- 5806 Ely Rd
- 1612 Hoover Trail Cir SW