Estimated Value: $122,825 - $139,000
6
Beds
1
Bath
3,229
Sq Ft
$41/Sq Ft
Est. Value
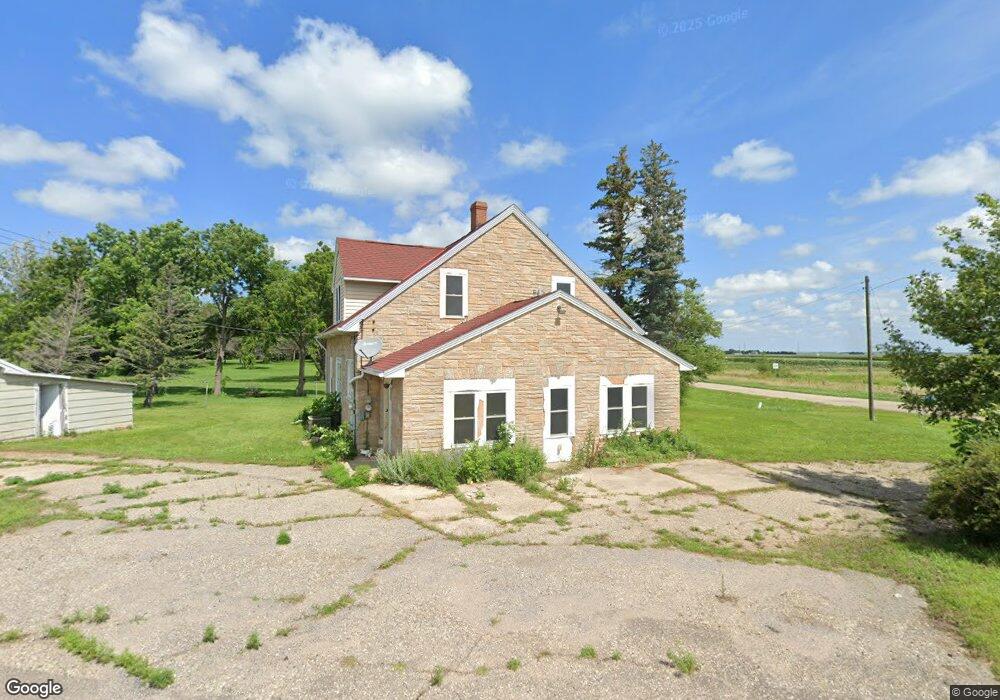
About This Home
This home is located at 1803 Front St, Tracy, MN 56175 and is currently estimated at $132,206, approximately $40 per square foot. 1803 Front St is a home located in Lyon County with nearby schools including Tracy Elementary School and Tracy Secondary School.
Ownership History
Date
Name
Owned For
Owner Type
Purchase Details
Closed on
Aug 9, 2019
Sold by
Vosberg Derek and Vosberg Shelby
Bought by
Edmundson Brianna Mae
Current Estimated Value
Purchase Details
Closed on
Dec 27, 2017
Sold by
Porter Karin L and Robert M Tessmann Trust
Bought by
Vosberg Derek
Home Financials for this Owner
Home Financials are based on the most recent Mortgage that was taken out on this home.
Original Mortgage
$46,550
Interest Rate
3.94%
Mortgage Type
New Conventional
Purchase Details
Closed on
Apr 6, 2017
Sold by
Tessmann Robert M and Tessmann Fay L
Bought by
Robert M Tessmann Trust
Create a Home Valuation Report for This Property
The Home Valuation Report is an in-depth analysis detailing your home's value as well as a comparison with similar homes in the area
Home Values in the Area
Average Home Value in this Area
Purchase History
| Date | Buyer | Sale Price | Title Company |
|---|---|---|---|
| Edmundson Brianna Mae | $74,900 | None Available | |
| Vosberg Derek | $49,000 | None Available | |
| Robert M Tessmann Trust | -- | None Available |
Source: Public Records
Mortgage History
| Date | Status | Borrower | Loan Amount |
|---|---|---|---|
| Previous Owner | Vosberg Derek | $46,550 |
Source: Public Records
Tax History Compared to Growth
Tax History
| Year | Tax Paid | Tax Assessment Tax Assessment Total Assessment is a certain percentage of the fair market value that is determined by local assessors to be the total taxable value of land and additions on the property. | Land | Improvement |
|---|---|---|---|---|
| 2025 | $580 | $108,900 | $2,200 | $106,700 |
| 2024 | $574 | $108,300 | $1,600 | $106,700 |
| 2023 | $562 | $105,500 | $1,600 | $103,900 |
| 2022 | $454 | $86,900 | $1,600 | $85,300 |
| 2021 | $436 | $76,800 | $1,600 | $75,200 |
| 2020 | $394 | $70,300 | $1,600 | $68,700 |
| 2019 | $340 | $64,200 | $1,600 | $62,600 |
| 2018 | $396 | $58,700 | $1,300 | $57,400 |
| 2017 | $396 | $58,700 | $1,300 | $57,400 |
| 2016 | $390 | $0 | $0 | $0 |
| 2015 | -- | $0 | $0 | $0 |
| 2014 | -- | $0 | $0 | $0 |
Source: Public Records
Map
Nearby Homes