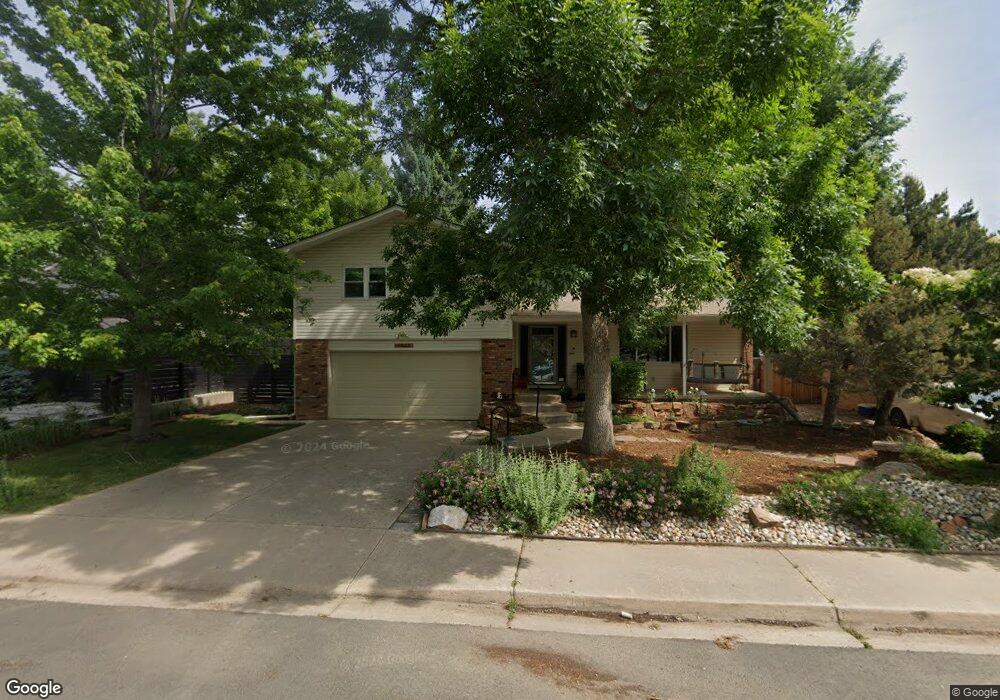
1803 Grape Ave Boulder, CO 80304
Central Boulder NeighborhoodEstimated Value: $1,192,981 - $1,828,000
4
Beds
3
Baths
1,806
Sq Ft
$827/Sq Ft
Est. Value
About This Home
This home is located at 1803 Grape Ave, Boulder, CO 80304 and is currently estimated at $1,492,995, approximately $826 per square foot. 1803 Grape Ave is a home located in Boulder County with nearby schools including Columbine Elementary School, Casey Middle School, and Boulder High School.
Ownership History
Date
Name
Owned For
Owner Type
Purchase Details
Closed on
Nov 1, 2022
Sold by
Philomena Dooiey Living Trust
Bought by
Philomena Dooley Living Trust
Current Estimated Value
Purchase Details
Closed on
Dec 10, 2008
Sold by
Dooley Philomena and Philomena Dooley Living Trust
Bought by
Dooley Philomena
Purchase Details
Closed on
Oct 31, 2006
Sold by
Dooley Philomena
Bought by
Dooley Philomena and Philomena Dooley Living Trust
Purchase Details
Closed on
Sep 30, 1997
Sold by
Morel Claude M and Morel Maxine B
Bought by
Dooley Philomena
Home Financials for this Owner
Home Financials are based on the most recent Mortgage that was taken out on this home.
Original Mortgage
$188,000
Interest Rate
4.95%
Purchase Details
Closed on
Jul 22, 1977
Bought by
Dooley Philomena Living Trust
Purchase Details
Closed on
Jun 3, 1975
Bought by
Dooley Philomena Living Trust
Create a Home Valuation Report for This Property
The Home Valuation Report is an in-depth analysis detailing your home's value as well as a comparison with similar homes in the area
Home Values in the Area
Average Home Value in this Area
Purchase History
| Date | Buyer | Sale Price | Title Company |
|---|---|---|---|
| Philomena Dooley Living Trust | -- | -- | |
| Dooley Philomena | -- | None Available | |
| Dooley Philomena | -- | None Available | |
| Dooley Philomena | $235,000 | Land Title | |
| Dooley Philomena Living Trust | $75,000 | -- | |
| Dooley Philomena Living Trust | $56,000 | -- |
Source: Public Records
Mortgage History
| Date | Status | Borrower | Loan Amount |
|---|---|---|---|
| Previous Owner | Dooley Philomena | $188,000 |
Source: Public Records
Tax History
| Year | Tax Paid | Tax Assessment Tax Assessment Total Assessment is a certain percentage of the fair market value that is determined by local assessors to be the total taxable value of land and additions on the property. | Land | Improvement |
|---|---|---|---|---|
| 2025 | $6,207 | $73,781 | $53,531 | $20,250 |
| 2024 | $6,207 | $73,781 | $53,531 | $20,250 |
| 2023 | $6,099 | $77,325 | $55,824 | $25,185 |
| 2022 | $5,137 | $62,265 | $42,346 | $19,919 |
| 2021 | $4,898 | $64,057 | $43,565 | $20,492 |
| 2020 | $4,388 | $57,565 | $46,046 | $11,519 |
| 2019 | $4,321 | $57,565 | $46,046 | $11,519 |
| 2018 | $3,875 | $51,890 | $33,912 | $17,978 |
| 2017 | $3,753 | $57,368 | $37,492 | $19,876 |
| 2016 | $3,743 | $51,199 | $27,860 | $23,339 |
| 2015 | $3,544 | $40,221 | $23,402 | $16,819 |
| 2014 | $2,713 | $40,221 | $23,402 | $16,819 |
Source: Public Records
Map
Nearby Homes
- 1805 Grape Ave
- 1777 Grape Ave
- 1820 Hawthorn Ave
- 1855 Garland Ln
- 1840 Hawthorn Ave
- 1840 Garland Ln
- 1780 Grape Ave
- 3315 19th St
- 3305 19th St
- 1771 Hawthorn Ave
- 1720 Grape Ave
- 1744 Hawthorn Ave
- 3325 19th St
- 1760 Grape Ave
- 3295 19th St
- 1755 Garland Ln
- 1751 Hawthorn Ave
- 1740 Grape Ave
- 1820 Garland Ln
- 1735 Garland Ln
Your Personal Tour Guide
Ask me questions while you tour the home.