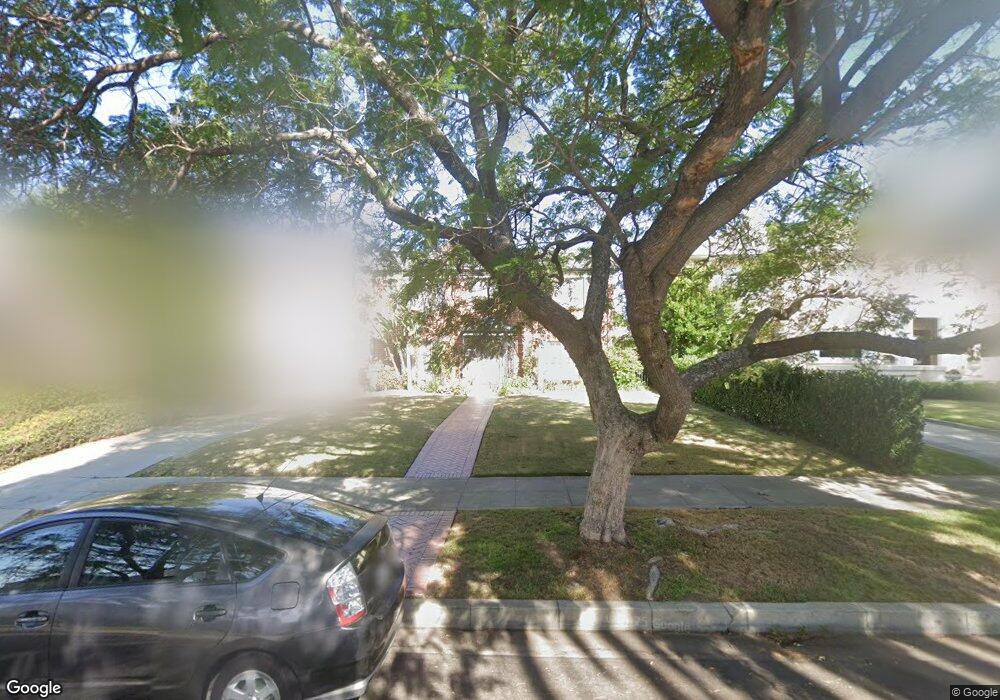
1803 Wellington Rd Los Angeles, CA 90019
Mid-City NeighborhoodEstimated Value: $1,775,556 - $2,123,000
2
Beds
2
Baths
2,714
Sq Ft
$707/Sq Ft
Est. Value
About This Home
This home is located at 1803 Wellington Rd, Los Angeles, CA 90019 and is currently estimated at $1,918,889, approximately $707 per square foot. 1803 Wellington Rd is a home located in Los Angeles County with nearby schools including Alta Loma Elementary, Johnnie L. Cochran Jr. Middle School, and Los Angeles Senior High School.
Ownership History
Date
Name
Owned For
Owner Type
Purchase Details
Closed on
Oct 21, 2010
Sold by
Kim Man Heup and Kim Hyun Sub
Bought by
Lee Gina
Current Estimated Value
Home Financials for this Owner
Home Financials are based on the most recent Mortgage that was taken out on this home.
Original Mortgage
$360,000
Outstanding Balance
$237,320
Interest Rate
4.33%
Mortgage Type
New Conventional
Estimated Equity
$1,681,569
Purchase Details
Closed on
May 3, 2002
Sold by
Blake I Charles E I and Blake Mae Lawrence
Bought by
Kim Man Heup
Home Financials for this Owner
Home Financials are based on the most recent Mortgage that was taken out on this home.
Original Mortgage
$270,000
Interest Rate
7.13%
Purchase Details
Closed on
Oct 13, 1994
Sold by
Blake Charles and Blake Mae
Bought by
Blake Charles E
Purchase Details
Closed on
Mar 28, 1994
Sold by
Powers Franklin K and Powers Frank K
Bought by
Blake Charles
Home Financials for this Owner
Home Financials are based on the most recent Mortgage that was taken out on this home.
Original Mortgage
$219,300
Interest Rate
7.25%
Create a Home Valuation Report for This Property
The Home Valuation Report is an in-depth analysis detailing your home's value as well as a comparison with similar homes in the area
Home Values in the Area
Average Home Value in this Area
Purchase History
| Date | Buyer | Sale Price | Title Company |
|---|---|---|---|
| Lee Gina | $580,000 | Chicago Title Company | |
| Kim Man Heup | $460,000 | South Coast Title Company | |
| Blake Charles E | -- | -- | |
| Blake Charles | $274,500 | South Coast Title |
Source: Public Records
Mortgage History
| Date | Status | Borrower | Loan Amount |
|---|---|---|---|
| Open | Lee Gina | $360,000 | |
| Previous Owner | Kim Man Heup | $270,000 | |
| Previous Owner | Blake Charles | $219,300 |
Source: Public Records
Tax History Compared to Growth
Tax History
| Year | Tax Paid | Tax Assessment Tax Assessment Total Assessment is a certain percentage of the fair market value that is determined by local assessors to be the total taxable value of land and additions on the property. | Land | Improvement |
|---|---|---|---|---|
| 2025 | $9,118 | $743,069 | $589,079 | $153,990 |
| 2024 | $9,118 | $728,500 | $577,529 | $150,971 |
| 2023 | $8,949 | $714,216 | $566,205 | $148,011 |
| 2022 | $8,544 | $700,212 | $555,103 | $145,109 |
| 2021 | $8,426 | $686,483 | $544,219 | $142,264 |
| 2019 | $8,177 | $666,124 | $528,078 | $138,046 |
| 2018 | $8,054 | $653,064 | $517,724 | $135,340 |
| 2016 | $7,685 | $627,707 | $497,621 | $130,086 |
| 2015 | $7,573 | $618,279 | $490,147 | $128,132 |
| 2014 | $7,603 | $606,169 | $480,546 | $125,623 |
Source: Public Records
Map
Nearby Homes
- 1685 S Victoria Ave
- 1663 Virginia Rd
- 1847 Virginia Rd
- 1650 Virginia Rd
- 1646 West Blvd
- 4516 St Charles Place
- 4400 W Washington Blvd
- 4512 St Elmo Dr
- 1638 S Victoria Ave
- 1746 Crenshaw Blvd
- 4533 Saturn St
- 4522 Saint Elmo Dr
- 4527 Saint Charles Place
- 4533 Saint Charles Place
- 4546 W 17th St
- 1603 Buckingham Rd
- 1604 La Fayette Rd
- 2125 Crenshaw Blvd
- 2104 Crenshaw Blvd
- 1947 S Bronson Ave
- 1809 Wellington Rd
- 1743 Wellington Rd
- 1815 Wellington Rd
- 1737 Wellington Rd
- 1752 Virginia Rd
- 1744 Virginia Rd
- 1800 Virginia Rd
- 1731 Wellington Rd
- 1823 Wellington Rd
- 1802 Wellington Rd
- 1806 Virginia Rd
- 1808 Wellington Rd
- 1742 Wellington Rd
- 1740 Virginia Rd
- 1736 Wellington Rd
- 1725 Wellington Rd
- 1818 Wellington Rd
- 1814 Virginia Rd
- 1730 Wellington Rd
- 1826 Wellington Rd