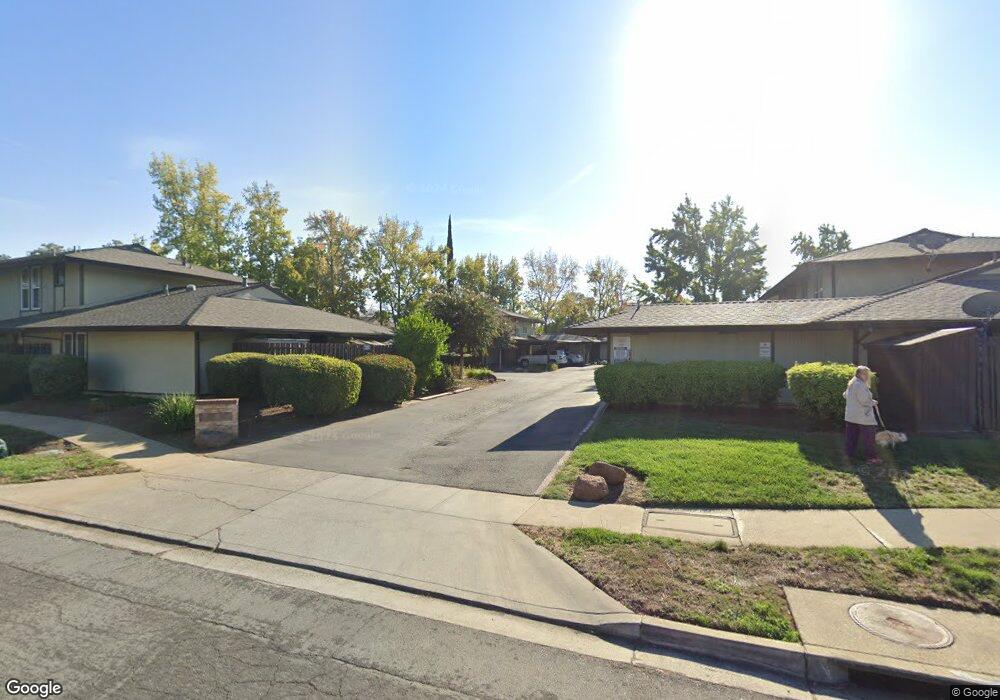
1804 Chinquapin Ct Unit B Concord, CA 94519
Dana Estates NeighborhoodEstimated Value: $419,000 - $485,000
2
Beds
2
Baths
1,015
Sq Ft
$442/Sq Ft
Est. Value
About This Home
This home is located at 1804 Chinquapin Ct Unit B, Concord, CA 94519 and is currently estimated at $448,189, approximately $441 per square foot. 1804 Chinquapin Ct Unit B is a home located in Contra Costa County with nearby schools including Westwood Elementary School, El Dorado Middle School, and Concord High School.
Ownership History
Date
Name
Owned For
Owner Type
Purchase Details
Closed on
Mar 15, 2023
Sold by
Zhao Ying
Bought by
Blair Kristine M and Blair Gary L
Current Estimated Value
Home Financials for this Owner
Home Financials are based on the most recent Mortgage that was taken out on this home.
Original Mortgage
$230,000
Outstanding Balance
$222,766
Interest Rate
6.12%
Mortgage Type
New Conventional
Estimated Equity
$225,423
Purchase Details
Closed on
Aug 10, 2010
Sold by
Spindler Cynthia Ann and Evetts Randy Ray
Bought by
Zhao Ying
Home Financials for this Owner
Home Financials are based on the most recent Mortgage that was taken out on this home.
Original Mortgage
$69,500
Interest Rate
4.52%
Mortgage Type
New Conventional
Create a Home Valuation Report for This Property
The Home Valuation Report is an in-depth analysis detailing your home's value as well as a comparison with similar homes in the area
Home Values in the Area
Average Home Value in this Area
Purchase History
| Date | Buyer | Sale Price | Title Company |
|---|---|---|---|
| Blair Kristine M | $430,000 | Chicago Title | |
| Zhao Ying | $127,500 | Old Republic Title Company |
Source: Public Records
Mortgage History
| Date | Status | Borrower | Loan Amount |
|---|---|---|---|
| Open | Blair Kristine M | $230,000 | |
| Previous Owner | Zhao Ying | $69,500 |
Source: Public Records
Tax History Compared to Growth
Tax History
| Year | Tax Paid | Tax Assessment Tax Assessment Total Assessment is a certain percentage of the fair market value that is determined by local assessors to be the total taxable value of land and additions on the property. | Land | Improvement |
|---|---|---|---|---|
| 2025 | $5,779 | $447,372 | $343,332 | $104,040 |
| 2024 | $2,563 | $438,600 | $336,600 | $102,000 |
| 2023 | $2,563 | $156,998 | $61,566 | $95,432 |
| 2022 | $2,503 | $153,920 | $60,359 | $93,561 |
| 2021 | $2,422 | $150,903 | $59,176 | $91,727 |
| 2019 | $2,358 | $146,429 | $57,422 | $89,007 |
| 2018 | $2,255 | $143,559 | $56,297 | $87,262 |
| 2017 | $2,162 | $140,745 | $55,194 | $85,551 |
| 2016 | $2,073 | $137,986 | $54,112 | $83,874 |
| 2015 | $2,016 | $135,915 | $53,300 | $82,615 |
| 2014 | $1,950 | $133,253 | $52,256 | $80,997 |
Source: Public Records
Map
Nearby Homes
- 1739 Sapling Ct Unit A
- 1715 West St
- 1693 Greentree Dr
- 3997 Mulberry Dr
- 4022 Wilson Ln
- 1682 Mendocino Dr
- 4081 Salem St
- 3718 Northpark Ct
- 1878 Denkinger Rd
- 1662 Dorchester Place
- 4048 Chestnut Ave
- 4044 Chestnut Ave
- 3774 Larch Ct
- 1685 Westchester Place
- 4020 Salem St
- 1579 West St
- 4272 Brentwood Cir
- 1828 Silverwood Dr
- 1828 Clayton Way
- 4067 Lillian Dr
- 1804 Chinquapin Ct Unit A
- 1804 Chinquapin Ct Unit C
- 1804 Chinquapin Ct Unit D
- 1814 Chinquapin Ct Unit A
- 1814 Chinquapin Ct Unit B
- 1814 Chinquapin Ct Unit C
- 1814 Chinquapin Ct Unit E
- 1814 Chinquapin Ct Unit F
- 1802 Chinquapin Ct Unit A
- 1802 Chinquapin Ct Unit B
- 1812 Chinquapin Ct Unit A
- 1812 Chinquapin Ct Unit B
- 1800 Chinquapin Ct Unit A
- 1800 Chinquapin Ct Unit B
- 1800 Chinquapin Ct Unit C
- 1800 Chinquapin Ct Unit D
- 1810 Chinquapin Ct Unit A
- 1810 Chinquapin Ct Unit B
- 1810 Chinquapin Ct Unit C
- 1810 Chinquapin Ct Unit D