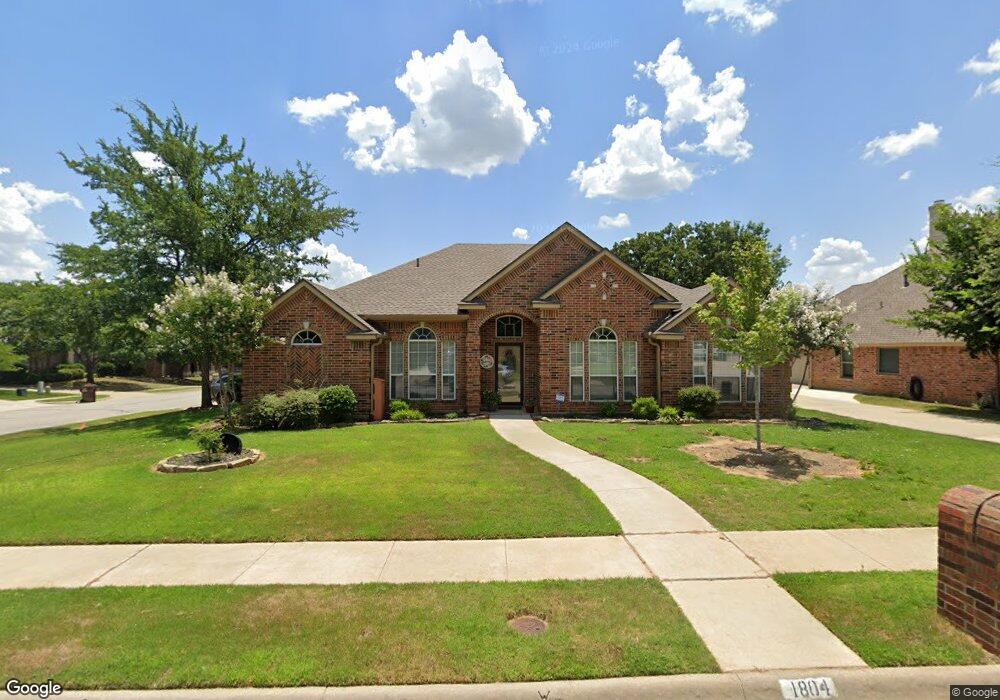
1804 Palo Verde Dr Denton, TX 76210
South Denton NeighborhoodEstimated Value: $408,000 - $427,000
3
Beds
2
Baths
2,243
Sq Ft
$186/Sq Ft
Est. Value
About This Home
This home is located at 1804 Palo Verde Dr, Denton, TX 76210 and is currently estimated at $417,718, approximately $186 per square foot. 1804 Palo Verde Dr is a home located in Denton County with nearby schools including McNair Elementary School, Crownover Middle School, and Guyer High School.
Ownership History
Date
Name
Owned For
Owner Type
Purchase Details
Closed on
Mar 18, 2014
Sold by
Jolley Carla and Witting Tracey
Bought by
Neely Michael and Neely Janet
Current Estimated Value
Home Financials for this Owner
Home Financials are based on the most recent Mortgage that was taken out on this home.
Original Mortgage
$85,000
Outstanding Balance
$23,894
Interest Rate
4.32%
Mortgage Type
New Conventional
Estimated Equity
$393,824
Purchase Details
Closed on
Aug 23, 2002
Sold by
Brentgate Homes Inc
Bought by
Jolley Carla and Witting Tracey
Home Financials for this Owner
Home Financials are based on the most recent Mortgage that was taken out on this home.
Original Mortgage
$156,560
Interest Rate
6.47%
Purchase Details
Closed on
Feb 14, 2002
Sold by
Vista Verde I
Bought by
Brentgate Homes Inc
Home Financials for this Owner
Home Financials are based on the most recent Mortgage that was taken out on this home.
Original Mortgage
$142,461
Interest Rate
7.05%
Mortgage Type
Purchase Money Mortgage
Create a Home Valuation Report for This Property
The Home Valuation Report is an in-depth analysis detailing your home's value as well as a comparison with similar homes in the area
Home Values in the Area
Average Home Value in this Area
Purchase History
| Date | Buyer | Sale Price | Title Company |
|---|---|---|---|
| Neely Michael | -- | Fatco | |
| Jolley Carla | -- | -- | |
| Brentgate Homes Inc | -- | -- | |
| Brentgate Homes Inc | -- | -- |
Source: Public Records
Mortgage History
| Date | Status | Borrower | Loan Amount |
|---|---|---|---|
| Open | Neely Michael | $85,000 | |
| Previous Owner | Jolley Carla | $156,560 | |
| Previous Owner | Brentgate Homes Inc | $142,461 | |
| Closed | Jolley Carla | $39,140 |
Source: Public Records
Tax History Compared to Growth
Tax History
| Year | Tax Paid | Tax Assessment Tax Assessment Total Assessment is a certain percentage of the fair market value that is determined by local assessors to be the total taxable value of land and additions on the property. | Land | Improvement |
|---|---|---|---|---|
| 2025 | $3,958 | $414,010 | $99,970 | $314,040 |
| 2024 | $8,136 | $421,488 | $0 | $0 |
| 2023 | $3,964 | $383,171 | $99,970 | $337,035 |
| 2022 | $7,395 | $348,337 | $87,474 | $304,115 |
| 2021 | $7,040 | $316,670 | $64,981 | $251,689 |
| 2020 | $6,719 | $293,934 | $64,981 | $228,953 |
| 2019 | $7,028 | $294,536 | $64,981 | $229,555 |
| 2018 | $7,025 | $290,803 | $52,484 | $238,319 |
| 2017 | $6,583 | $266,331 | $52,484 | $213,847 |
| 2016 | $6,434 | $250,136 | $52,484 | $197,652 |
| 2015 | $4,673 | $224,870 | $52,484 | $172,386 |
| 2014 | $4,673 | $197,397 | $43,487 | $153,910 |
| 2013 | -- | $183,714 | $43,487 | $140,227 |
Source: Public Records
Map
Nearby Homes
- 7100 Frost Ln
- 7301 Chaucer Dr
- 7305 Mira Vista Dr
- 1617 Glendora Ct
- 1605 Cordero Ct
- 2109 Hemingway Dr
- 1917 Prescott Downs Dr
- 1917 Belmont Park Dr
- 2109 Doecrest Dr
- 1612 Marble Cove Ln
- 2112 Del Mar Ct
- 2005 Creekdale Dr
- 7804 Hidden Path Ln
- 7912 Hidden Path Ln
- 1201 Buena Vista Dr
- 1517 Miranda Ln
- 2316 Del Mar Ct
- 4613 Bernstein Blvd
- 1913 Pavilion Ln
- 4125 Colina Ave
- 1800 Palo Verde Dr
- 1805 Cordero Ct
- 1801 Cordero Ct
- 1708 Palo Verde Dr
- 7005 Mira Vista Dr
- 7009 Mira Vista Dr
- 1801 Palo Verde Dr
- 1805 Palo Verde Dr
- 1709 Cordero Ct
- 7001 Mira Vista Dr
- 7101 Mira Vista Dr
- 1713 Palo Verde Dr
- 1704 Palo Verde Dr
- 1809 Palo Verde Dr
- 1705 Cordero Ct
- 1709 Palo Verde Dr
- 7105 Mira Vista Dr
- 1804 Cordero Ct
- 7100 Chaucer Dr
- 7008 Chaucer Dr