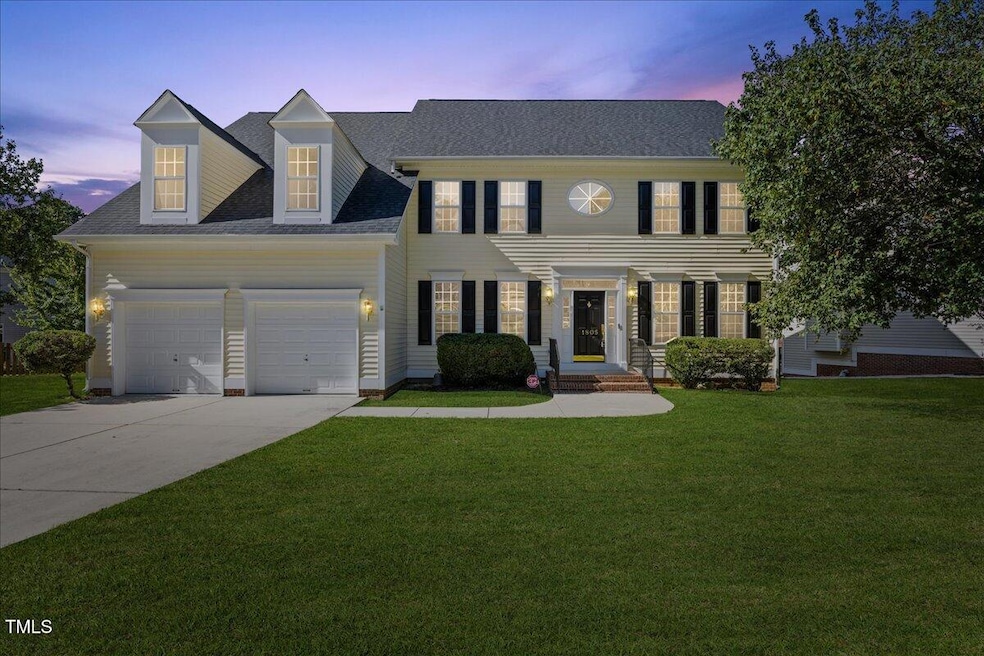


1805 Abby Knoll Dr Apex, NC 27502
Beaver Creek NeighborhoodEstimated payment $4,660/month
Highlights
- Colonial Architecture
- Deck
- 2 Car Attached Garage
- Salem Elementary Rated A
- Fireplace
- Recessed Lighting
About This Home
Welcome to 1805 Abby Knoll Drive — a beautifully updated, move-in-ready home just one mile from Beaver Creek Commons in the sought-after Haddon Hall community.
This home features a brand-new 2025 roof, a fully renovated kitchen with new cabinetry, granite countertops, tile backsplash, and updated flooring, plus modern fixtures throughout. Bathrooms have been upgraded with new countertops, a refreshed primary shower, and spa-like finishes.
Enjoy fresh paint, recessed lighting, refinished fireplace surround, and soaring ceilings in the living room, all complemented by warm hardwood floors.
Located in the prestigious Haddon Hall, residents enjoy top-tier amenities including a pool, clubhouse, and tennis courts.
Don't miss this rare opportunity to own a like-new home in one of Apex's most desirable communities!

Home Details
Home Type
- Single Family
Est. Annual Taxes
- $5,901
Year Built
- Built in 2000
Lot Details
- 0.26 Acre Lot
- Cleared Lot
HOA Fees
- $43 Monthly HOA Fees
Parking
- 2 Car Attached Garage
Home Design
- Colonial Architecture
- Brick Exterior Construction
- Raised Foundation
- Shingle Roof
- Vinyl Siding
Interior Spaces
- 3,443 Sq Ft Home
- 2-Story Property
- Recessed Lighting
- Fireplace
- Laundry Room
Flooring
- Carpet
- Tile
- Luxury Vinyl Tile
Bedrooms and Bathrooms
- 4 Bedrooms
Outdoor Features
- Deck
Schools
- Salem Elementary And Middle School
- Apex High School
Utilities
- Central Heating and Cooling System
- Natural Gas Connected
Community Details
- Association fees include road maintenance
- Haddon Hall HOA, Phone Number (919) 787-9000
- Haddon Hall Subdivision
Listing and Financial Details
- Assessor Parcel Number 0742162693
Map
Home Values in the Area
Average Home Value in this Area
Tax History
| Year | Tax Paid | Tax Assessment Tax Assessment Total Assessment is a certain percentage of the fair market value that is determined by local assessors to be the total taxable value of land and additions on the property. | Land | Improvement |
|---|---|---|---|---|
| 2025 | $6,036 | $689,039 | $170,000 | $519,039 |
| 2024 | $5,901 | $689,039 | $170,000 | $519,039 |
| 2023 | $4,741 | $430,348 | $75,000 | $355,348 |
| 2022 | $4,450 | $430,348 | $75,000 | $355,348 |
| 2021 | $4,280 | $430,348 | $75,000 | $355,348 |
| 2020 | $4,237 | $430,348 | $75,000 | $355,348 |
| 2019 | $4,155 | $364,085 | $88,000 | $276,085 |
| 2018 | $3,914 | $364,085 | $88,000 | $276,085 |
| 2017 | $3,643 | $364,085 | $88,000 | $276,085 |
| 2016 | $3,590 | $364,085 | $88,000 | $276,085 |
| 2015 | $3,603 | $356,645 | $78,000 | $278,645 |
| 2014 | $3,472 | $356,645 | $78,000 | $278,645 |
Property History
| Date | Event | Price | List to Sale | Price per Sq Ft |
|---|---|---|---|---|
| 09/10/2025 09/10/25 | Pending | -- | -- | -- |
| 09/04/2025 09/04/25 | For Sale | $775,000 | -- | $225 / Sq Ft |
Purchase History
| Date | Type | Sale Price | Title Company |
|---|---|---|---|
| Warranty Deed | -- | None Listed On Document | |
| Interfamily Deed Transfer | -- | None Available | |
| Warranty Deed | $244,000 | -- |
Mortgage History
| Date | Status | Loan Amount | Loan Type |
|---|---|---|---|
| Previous Owner | $256,000 | New Conventional | |
| Previous Owner | $194,931 | No Value Available |
Source: Doorify MLS
MLS Number: 10119602
APN: 0742.09-16-2693-000
Disclaimer: Certain information contained herein is derived from information provided by parties other than Homes.com. All information provided is deemed reliable, but is not guaranteed to be accurate and should be independently verified.
![]() Some IDX listings have been excluded from this IDX display. Brokers make an effort to deliver accurate information, but buyers should independently verify any information on which they will rely in a transaction. The listing broker shall not be responsible for any typographical errors, misinformation, or misprints, and they shall be held totally harmless from any damages arising from reliance upon this data. This data is provided exclusively for consumers’ personal, non-commercial use. Listings marked with an icon are provided courtesy of the Doorify MLS, Inc. of North Carolina, Internet Data Exchange Database. Closed (sold) listings may have been listed and/or sold by a real estate firm other than the firm(s) featured on this website. Closed data is not available until the sale of the property is recorded in the MLS. Home sale data is not an appraisal, CMA, competitive or comparative market analysis, or home valuation of any property. Copyright 2025 Doorify MLS, Inc. of North Carolina. All rights reserved.
Some IDX listings have been excluded from this IDX display. Brokers make an effort to deliver accurate information, but buyers should independently verify any information on which they will rely in a transaction. The listing broker shall not be responsible for any typographical errors, misinformation, or misprints, and they shall be held totally harmless from any damages arising from reliance upon this data. This data is provided exclusively for consumers’ personal, non-commercial use. Listings marked with an icon are provided courtesy of the Doorify MLS, Inc. of North Carolina, Internet Data Exchange Database. Closed (sold) listings may have been listed and/or sold by a real estate firm other than the firm(s) featured on this website. Closed data is not available until the sale of the property is recorded in the MLS. Home sale data is not an appraisal, CMA, competitive or comparative market analysis, or home valuation of any property. Copyright 2025 Doorify MLS, Inc. of North Carolina. All rights reserved.
- 1477 Orchard Villas Ave
- 900 Haddon Hall Dr
- 1515 Orchard Villas Ave Unit 1515
- 907 Haddon Hall Dr
- 235 Eyam Hall Ln
- 233 Eyam Hall Ln
- 427 Eyam Hall Ln
- 1527 Haywards Heath Ln
- 102 Darley Dale Loop
- 802 Winter Hill Dr
- 7736 Roberts Rd
- 1009 Magnolia Leaf Ct
- 622 Sunset Ave
- 406 Abbey Oak Ln
- 105 Troyer Place
- 960 Branch Line Ln
- 919 Branch Line Ln
- 1705 Pointe Crossing
- 1119 Platform Dr
- 1800 Pierre Place