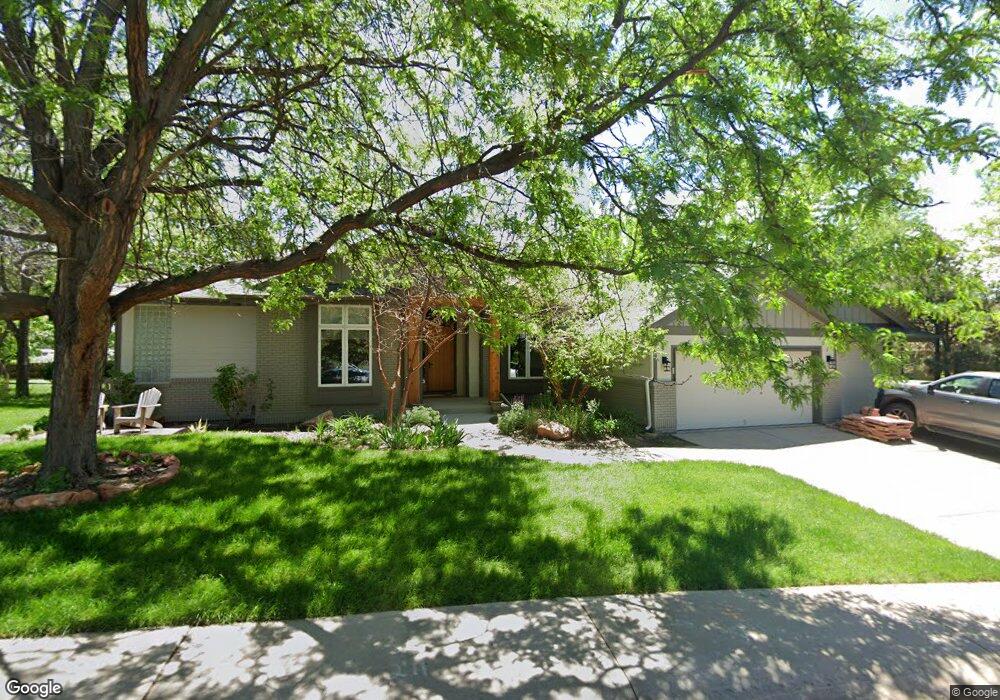
1806 Westview Rd Fort Collins, CO 80524
Estimated Value: $938,000 - $1,103,000
4
Beds
4
Baths
2,438
Sq Ft
$419/Sq Ft
Est. Value
About This Home
This home is located at 1806 Westview Rd, Fort Collins, CO 80524 and is currently estimated at $1,022,384, approximately $419 per square foot. 1806 Westview Rd is a home located in Larimer County with nearby schools including Tavelli Elementary School, Cache La Poudre Middle School, and Poudre High School.
Ownership History
Date
Name
Owned For
Owner Type
Purchase Details
Closed on
Nov 15, 2000
Sold by
Stockover William C and Stockover Maureen D
Bought by
Stockover William C
Current Estimated Value
Purchase Details
Closed on
Oct 31, 1997
Sold by
Did Development Corp
Bought by
Stockover William C and Stockover Maureen D
Home Financials for this Owner
Home Financials are based on the most recent Mortgage that was taken out on this home.
Original Mortgage
$284,000
Outstanding Balance
$46,815
Interest Rate
7.33%
Estimated Equity
$975,569
Purchase Details
Closed on
Jan 20, 1997
Sold by
Duncan Diane I
Bought by
D I D Development Corp
Home Financials for this Owner
Home Financials are based on the most recent Mortgage that was taken out on this home.
Original Mortgage
$250,000
Interest Rate
5.75%
Purchase Details
Closed on
Nov 1, 1993
Sold by
Nordic Construction & Development Inc
Bought by
Schrader Mary Susan
Create a Home Valuation Report for This Property
The Home Valuation Report is an in-depth analysis detailing your home's value as well as a comparison with similar homes in the area
Home Values in the Area
Average Home Value in this Area
Purchase History
| Date | Buyer | Sale Price | Title Company |
|---|---|---|---|
| Stockover William C | -- | -- | |
| Stockover William C | $35,600 | -- | |
| D I D Development Corp | -- | -- | |
| Duncan Diane I | $345,000 | -- | |
| Schrader Mary Susan | $315,000 | -- |
Source: Public Records
Mortgage History
| Date | Status | Borrower | Loan Amount |
|---|---|---|---|
| Open | Stockover William C | $284,000 | |
| Previous Owner | Duncan Diane I | $250,000 |
Source: Public Records
Tax History Compared to Growth
Tax History
| Year | Tax Paid | Tax Assessment Tax Assessment Total Assessment is a certain percentage of the fair market value that is determined by local assessors to be the total taxable value of land and additions on the property. | Land | Improvement |
|---|---|---|---|---|
| 2025 | $6,437 | $70,772 | $5,695 | $65,077 |
| 2024 | $6,125 | $70,772 | $5,695 | $65,077 |
| 2022 | $5,041 | $53,383 | $5,908 | $47,475 |
| 2021 | $5,094 | $54,920 | $6,078 | $48,842 |
| 2020 | $5,064 | $54,126 | $6,078 | $48,048 |
| 2019 | $5,086 | $54,126 | $6,078 | $48,048 |
| 2018 | $4,977 | $54,612 | $6,120 | $48,492 |
| 2017 | $4,960 | $54,612 | $6,120 | $48,492 |
| 2016 | $4,497 | $49,264 | $6,766 | $42,498 |
| 2015 | $4,465 | $49,270 | $6,770 | $42,500 |
| 2014 | $3,628 | $39,770 | $6,770 | $33,000 |
Source: Public Records
Map
Nearby Homes
- 0 Lorraine Dr
- 936 Bramblebush St
- 765 Nob Hill Ln
- 2115 Lindenmeier Rd
- 1013 E Willox Ln
- 1746 Valley View Ln
- 1208 Miramont Dr
- 312 Butch Cassidy Dr Unit 4
- 1132 Country Club Rd
- 933 E Ridgecrest Rd
- 1328 Hillside Dr
- 1300 Steeplechase Dr
- 901 Club View Rd
- 901 Gregory Rd
- 938 Schlagel St Unit 7
- 1412 Wimbledon Ct
- 624 Lupine Dr
- 945 Abbott Ln Unit 4
- 919 Schlagel St Unit 3
- 919 Schlagel St Unit 7
- 1800 Westview Rd
- 800 Lowell Ln
- 725 Blue Teal Dr
- 1818 Westview Rd
- 1724 Westview Rd
- 1725 Westview Rd
- 1905 Lorraine Dr
- 719 Blue Teal Dr
- 1824 Westview Rd
- 1817 Lorraine Dr
- 1718 Westview Rd
- 724 Blue Teal Dr
- 1913 Lorraine Dr
- 713 Blue Teal Dr
- 718 Blue Teal Dr
- 1900 Lorraine Dr
- 1712 Westview Rd
- 1713 Westview Rd
- 1831 Westview Rd
- 1824 Lorraine Dr