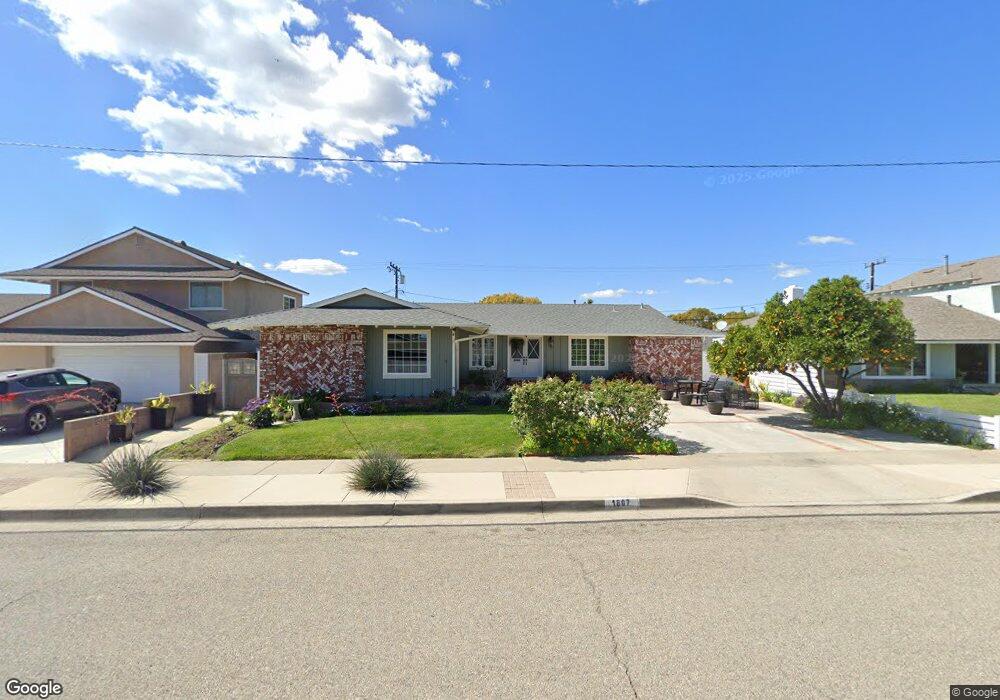
1807 Cambridge Ave Placentia, CA 92870
Estimated Value: $1,043,000 - $1,106,224
3
Beds
2
Baths
1,810
Sq Ft
$596/Sq Ft
Est. Value
About This Home
This home is located at 1807 Cambridge Ave, Placentia, CA 92870 and is currently estimated at $1,078,806, approximately $596 per square foot. 1807 Cambridge Ave is a home located in Orange County with nearby schools including Sierra Vista Elementary School, Col. J. K. Tuffree Middle School, and El Dorado High School.
Ownership History
Date
Name
Owned For
Owner Type
Purchase Details
Closed on
Oct 25, 2010
Sold by
Hefty Joann M and Hefty Joann M Schuck
Bought by
Hefty Joann M
Current Estimated Value
Home Financials for this Owner
Home Financials are based on the most recent Mortgage that was taken out on this home.
Original Mortgage
$30,000
Outstanding Balance
$19,854
Interest Rate
4.33%
Mortgage Type
Credit Line Revolving
Estimated Equity
$1,058,952
Purchase Details
Closed on
Jul 10, 2002
Sold by
Schuck John Edward
Bought by
Hefty Joann M Schuck
Home Financials for this Owner
Home Financials are based on the most recent Mortgage that was taken out on this home.
Original Mortgage
$103,500
Interest Rate
6.7%
Purchase Details
Closed on
Mar 31, 2001
Sold by
Schuck Edward G and Schuck Alice M
Bought by
Schuck Alice M and Alice M Schuck Trust
Purchase Details
Closed on
Apr 18, 1997
Sold by
Schuck Edward G and Schuck Alice M
Bought by
Schuck Edward G and Schuck Alice M
Create a Home Valuation Report for This Property
The Home Valuation Report is an in-depth analysis detailing your home's value as well as a comparison with similar homes in the area
Home Values in the Area
Average Home Value in this Area
Purchase History
| Date | Buyer | Sale Price | Title Company |
|---|---|---|---|
| Hefty Joann M | -- | -- | |
| Hefty Joann M Schuck | $172,500 | Orange Coast Title | |
| Schuck Alice M | -- | -- | |
| Schuck Edward G | -- | -- |
Source: Public Records
Mortgage History
| Date | Status | Borrower | Loan Amount |
|---|---|---|---|
| Open | Hefty Joann M | $30,000 | |
| Closed | Hefty Joann M Schuck | $103,500 |
Source: Public Records
Tax History Compared to Growth
Tax History
| Year | Tax Paid | Tax Assessment Tax Assessment Total Assessment is a certain percentage of the fair market value that is determined by local assessors to be the total taxable value of land and additions on the property. | Land | Improvement |
|---|---|---|---|---|
| 2025 | $1,709 | $86,482 | $27,529 | $58,953 |
| 2024 | $1,709 | $84,787 | $26,989 | $57,798 |
| 2023 | $1,642 | $83,125 | $26,460 | $56,665 |
| 2022 | $1,572 | $81,496 | $25,942 | $55,554 |
| 2021 | $1,496 | $79,899 | $25,434 | $54,465 |
| 2020 | $1,498 | $79,080 | $25,173 | $53,907 |
| 2019 | $1,424 | $77,530 | $24,680 | $52,850 |
| 2018 | $1,400 | $76,010 | $24,196 | $51,814 |
| 2017 | $1,372 | $74,520 | $23,721 | $50,799 |
| 2016 | $1,346 | $73,059 | $23,256 | $49,803 |
| 2015 | $1,323 | $71,962 | $22,907 | $49,055 |
| 2014 | $1,293 | $70,553 | $22,458 | $48,095 |
Source: Public Records
Map
Nearby Homes
- 1717 Saint James Place
- 2885 Winchester St
- 2454 Beacon St
- 1707 Stanley Ave
- 1726 Stanley Ave
- 3110 E Palm Dr Unit 14
- 2625 Andover Ave
- 1925 Frederick St
- 3043 Topaz Ln
- 3049 Topaz Ln
- 1525 Welldow Ln Unit 149
- 2878 Treeview Place
- 3037 Garnet Ln
- 2014 Associated Rd Unit 2
- 2946 Pembroke Ct
- 2040 Woodbriar Ct
- 3100 Garnet Ln
- 2416 Pinecrest Ct
- 2827 Park Vista Ct
- 3117 Pearl Dr
- 1813 Cambridge Ave
- 1801 Cambridge Ave
- 2242 Hartford Ave
- 2254 Hartford Ave
- 1755 Cambridge Ave
- 1819 Cambridge Ave
- 637 Joan Way
- 638 Barker Way
- 2236 Hartford Ave
- 2300 Hartford Ave
- 1749 Cambridge Ave
- 1825 Cambridge Ave
- 631 Joan Way
- 2230 Hartford Ave
- 632 Barker Way
- 2306 Hartford Ave
- 638 Joan Way
- 637 Barker Way
- 2249 Hartford Ave
- 2255 Hartford Ave