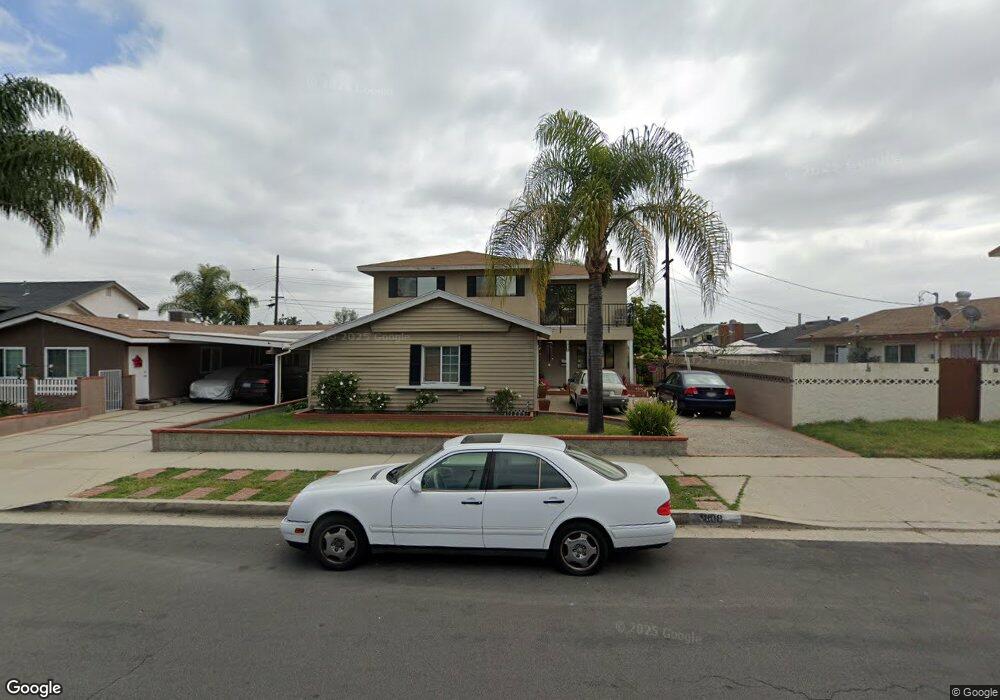
1808 Casey Place San Pedro, CA 90731
Estimated Value: $1,001,000 - $1,275,000
5
Beds
4
Baths
2,656
Sq Ft
$431/Sq Ft
Est. Value
About This Home
This home is located at 1808 Casey Place, San Pedro, CA 90731 and is currently estimated at $1,145,368, approximately $431 per square foot. 1808 Casey Place is a home located in Los Angeles County with nearby schools including Taper Avenue Elementary School, Rudecinda Sepulveda Dodson Middle, and San Pedro Senior High School.
Ownership History
Date
Name
Owned For
Owner Type
Purchase Details
Closed on
Nov 15, 2023
Sold by
Modugno Carol Ann
Bought by
Carol Ann Modugno Trust and Modugno
Current Estimated Value
Purchase Details
Closed on
Feb 27, 2012
Sold by
Quezada Maria Del Carmen
Bought by
Quezada Maria Del Carmen
Purchase Details
Closed on
Dec 20, 2011
Sold by
Higham Jeffery Michael
Bought by
Higham Jeffery Michael and Modugno Carol Ann
Purchase Details
Closed on
Apr 1, 2003
Sold by
Higham Margene
Bought by
Higham Jeff and Higham Carol
Purchase Details
Closed on
Aug 7, 1997
Sold by
Ruse Gerald
Bought by
Higham Margene R
Home Financials for this Owner
Home Financials are based on the most recent Mortgage that was taken out on this home.
Original Mortgage
$202,500
Interest Rate
7.43%
Create a Home Valuation Report for This Property
The Home Valuation Report is an in-depth analysis detailing your home's value as well as a comparison with similar homes in the area
Home Values in the Area
Average Home Value in this Area
Purchase History
| Date | Buyer | Sale Price | Title Company |
|---|---|---|---|
| Carol Ann Modugno Trust | -- | None Listed On Document | |
| Quezada Maria Del Carmen | -- | None Available | |
| Higham Jeffery Michael | -- | None Available | |
| Higham Jeff | -- | -- | |
| Higham Margene R | $270,000 | First American Title Co |
Source: Public Records
Mortgage History
| Date | Status | Borrower | Loan Amount |
|---|---|---|---|
| Previous Owner | Higham Margene R | $202,500 | |
| Closed | Higham Margene R | $40,500 |
Source: Public Records
Tax History
| Year | Tax Paid | Tax Assessment Tax Assessment Total Assessment is a certain percentage of the fair market value that is determined by local assessors to be the total taxable value of land and additions on the property. | Land | Improvement |
|---|---|---|---|---|
| 2025 | $5,377 | $431,104 | $280,221 | $150,883 |
| 2024 | $5,377 | $422,652 | $274,727 | $147,925 |
| 2023 | $5,276 | $414,366 | $269,341 | $145,025 |
| 2022 | $5,036 | $406,242 | $264,060 | $142,182 |
| 2021 | $4,961 | $398,278 | $258,883 | $139,395 |
| 2019 | $4,815 | $386,466 | $251,205 | $135,261 |
| 2018 | $4,731 | $378,889 | $246,280 | $132,609 |
| 2016 | $4,496 | $364,177 | $236,717 | $127,460 |
| 2015 | $4,432 | $358,708 | $233,162 | $125,546 |
| 2014 | $4,451 | $351,682 | $228,595 | $123,087 |
Source: Public Records
Map
Nearby Homes
- 813 Statler St
- 1839 N Taper Ave
- 1224 Westmont Dr
- 1280 Stonewood Ct Unit 31
- 2146 Mount Shasta Dr
- 2180 Mount Shasta Dr
- 1129 W Capitol Dr Unit 27
- 1414 Sea Ln
- 1150 W Capitol Dr Unit 18
- 1468 W Longview Ln
- 1469 Reef Ln
- 1625 Stonewood Ct
- 1468 Longview Ln
- 1481 Reef Ln
- 1473 Reef Ln
- 1485 Reef Ln
- 1410 Brett Place Unit 334
- 1410 Brett Place Unit 238
- 1482 Skyline Ln
- 1477 Reef Ln
- 1812 Casey Place
- 844 Barhugh Place
- 838 Barhugh Place
- 1818 Casey Place
- 1809 Bolker Place
- 834 Barhugh Place
- 1813 Bolker Place
- 1819 Bolker Place
- 1826 Casey Place
- 828 Barhugh Place
- 1825 Bolker Place
- 1832 Casey Place
- 1829 Bolker Place
- 843 Barhugh Place
- 837 Barhugh Place
- 849 Barhugh Place
- 1838 Casey Place
- 833 Barhugh Place
- 816 Barhugh Place
- 901 Barhugh Place
Your Personal Tour Guide
Ask me questions while you tour the home.