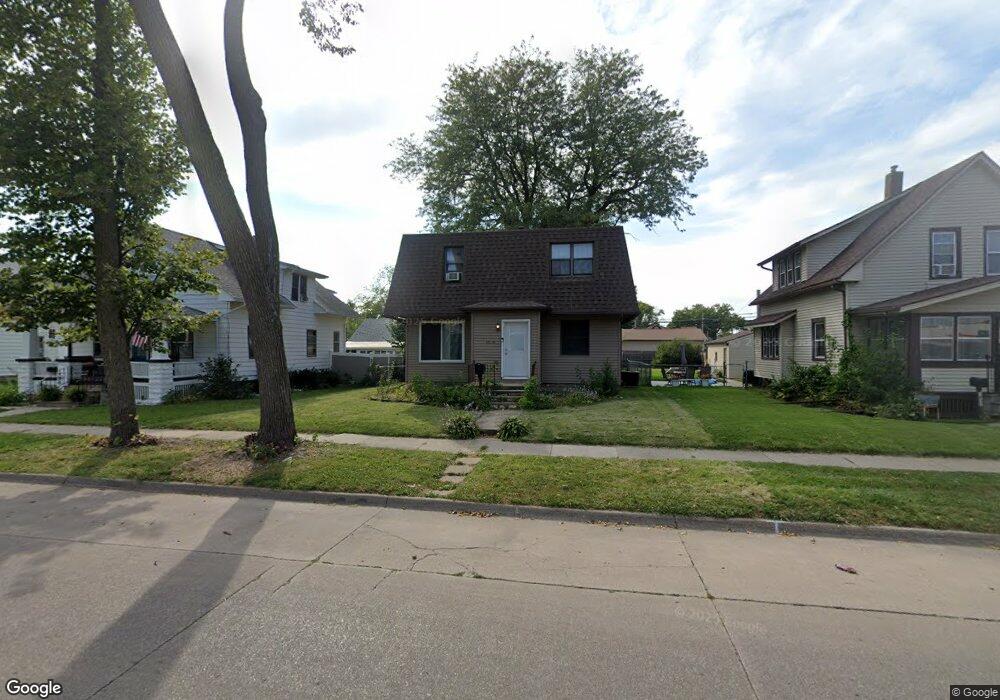
1808 J St SW Cedar Rapids, IA 52404
Southwest Area NeighborhoodEstimated Value: $178,000 - $189,282
3
Beds
2
Baths
1,400
Sq Ft
$129/Sq Ft
Est. Value
About This Home
This home is located at 1808 J St SW, Cedar Rapids, IA 52404 and is currently estimated at $181,071, approximately $129 per square foot. 1808 J St SW is a home located in Linn County with nearby schools including Junction City Elementary School, Grant Elementary School, and Bruce Hall Day Treatment Center.
Ownership History
Date
Name
Owned For
Owner Type
Purchase Details
Closed on
Aug 21, 2018
Sold by
Wells Fargo Bank Na
Bought by
Rollinger Jay Victor
Current Estimated Value
Purchase Details
Closed on
Sep 12, 2017
Sold by
Sherriff Of Linn County
Bought by
Wells Fargo Bank Na
Purchase Details
Closed on
Oct 1, 1999
Sold by
Holtz Richard A and Holtz Dawn M
Bought by
Block Allen J and Block Dawn M
Home Financials for this Owner
Home Financials are based on the most recent Mortgage that was taken out on this home.
Original Mortgage
$76,950
Interest Rate
7.87%
Create a Home Valuation Report for This Property
The Home Valuation Report is an in-depth analysis detailing your home's value as well as a comparison with similar homes in the area
Home Values in the Area
Average Home Value in this Area
Purchase History
| Date | Buyer | Sale Price | Title Company |
|---|---|---|---|
| Rollinger Jay Victor | $80,500 | None Available | |
| Wells Fargo Bank Na | $84,921 | None Available | |
| Block Allen J | $85,000 | -- |
Source: Public Records
Mortgage History
| Date | Status | Borrower | Loan Amount |
|---|---|---|---|
| Previous Owner | Block Allen J | $76,950 |
Source: Public Records
Tax History Compared to Growth
Tax History
| Year | Tax Paid | Tax Assessment Tax Assessment Total Assessment is a certain percentage of the fair market value that is determined by local assessors to be the total taxable value of land and additions on the property. | Land | Improvement |
|---|---|---|---|---|
| 2025 | $3,026 | $189,500 | $29,300 | $160,200 |
| 2024 | $100 | $180,600 | $25,500 | $155,100 |
| 2023 | $100 | $171,000 | $25,500 | $145,500 |
| 2022 | $107 | $150,400 | $25,500 | $124,900 |
| 2021 | $2,902 | $144,100 | $23,000 | $121,100 |
| 2020 | $121 | $131,500 | $23,000 | $108,500 |
| 2019 | $3,069 | $136,500 | $25,500 | $111,000 |
| 2018 | $2,678 | $136,500 | $25,500 | $111,000 |
| 2017 | $2,678 | $137,900 | $25,500 | $112,400 |
| 2016 | $2,859 | $134,500 | $25,500 | $109,000 |
| 2015 | $2,617 | $123,009 | $25,500 | $97,509 |
| 2014 | $2,432 | $123,009 | $25,500 | $97,509 |
| 2013 | $2,376 | $123,009 | $25,500 | $97,509 |
Source: Public Records
Map
Nearby Homes
- 1906 K St SW
- 192 15th Ave SW
- 280 14th Ave SW
- 1411 1st St SW
- 186 22nd Ave SW
- 2021 Hamilton St SW
- 1323 M St SW
- 1435 N St SW
- 1426 N St SW
- 1300 M St SW
- 1119 3rd St SW
- 2448 2nd St SW
- 657 16th Ave SW
- 804 N St SW
- 648 22nd Ave SW
- 919 6th St SW
- 358 8th Ave SW
- 411 8th Ave SW
- 2401 Victoria Dr SW
- 826 21st Ave SW