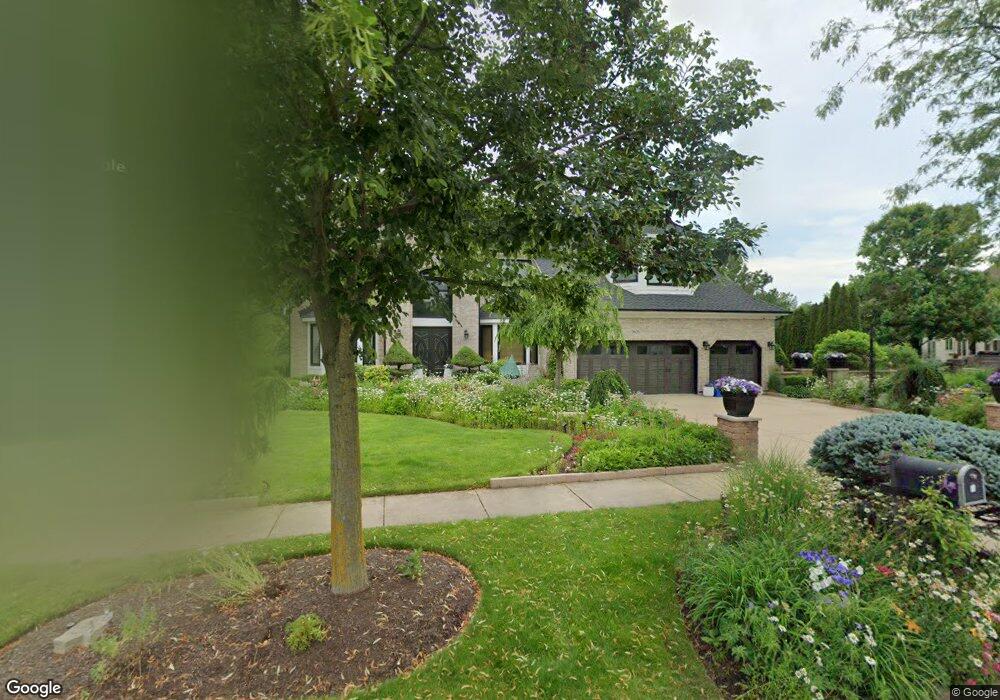
1808 Robert Ln Unit 3 Naperville, IL 60564
River Run NeighborhoodEstimated Value: $932,852 - $1,054,000
--
Bed
--
Bath
3,920
Sq Ft
$251/Sq Ft
Est. Value
About This Home
This home is located at 1808 Robert Ln Unit 3, Naperville, IL 60564 and is currently estimated at $984,963, approximately $251 per square foot. 1808 Robert Ln Unit 3 is a home located in Will County with nearby schools including Graham Elementary School, Ellsworth Elementary School, and Clifford Crone Middle School.
Ownership History
Date
Name
Owned For
Owner Type
Purchase Details
Closed on
Dec 11, 2002
Sold by
Scavetta Jennifer
Bought by
Scavetta Peter L and Scavetta Jennifer
Current Estimated Value
Home Financials for this Owner
Home Financials are based on the most recent Mortgage that was taken out on this home.
Original Mortgage
$455,000
Outstanding Balance
$191,221
Interest Rate
5.94%
Mortgage Type
Purchase Money Mortgage
Estimated Equity
$793,742
Purchase Details
Closed on
Nov 20, 2001
Sold by
Young Jeffrey M and Young Sheryl K
Bought by
Scavetta Jennifer
Home Financials for this Owner
Home Financials are based on the most recent Mortgage that was taken out on this home.
Original Mortgage
$456,000
Interest Rate
7.26%
Purchase Details
Closed on
Sep 13, 1996
Sold by
Oak Hill Builders Inc
Bought by
Young Jeffrey M and Young Sheryl K
Home Financials for this Owner
Home Financials are based on the most recent Mortgage that was taken out on this home.
Original Mortgage
$280,000
Interest Rate
7.62%
Create a Home Valuation Report for This Property
The Home Valuation Report is an in-depth analysis detailing your home's value as well as a comparison with similar homes in the area
Home Values in the Area
Average Home Value in this Area
Purchase History
| Date | Buyer | Sale Price | Title Company |
|---|---|---|---|
| Scavetta Peter L | -- | Chicago Title Insurance Co | |
| Scavetta Jennifer | $570,000 | Law Title | |
| Young Jeffrey M | $402,000 | -- |
Source: Public Records
Mortgage History
| Date | Status | Borrower | Loan Amount |
|---|---|---|---|
| Open | Scavetta Peter L | $455,000 | |
| Previous Owner | Scavetta Jennifer | $456,000 | |
| Previous Owner | Young Jeffrey M | $280,000 |
Source: Public Records
Tax History Compared to Growth
Tax History
| Year | Tax Paid | Tax Assessment Tax Assessment Total Assessment is a certain percentage of the fair market value that is determined by local assessors to be the total taxable value of land and additions on the property. | Land | Improvement |
|---|---|---|---|---|
| 2024 | $16,868 | $265,525 | $60,808 | $204,717 |
| 2023 | $16,868 | $259,147 | $53,717 | $205,430 |
| 2022 | $14,725 | $214,102 | $50,815 | $163,287 |
| 2021 | $14,061 | $203,906 | $48,395 | $155,511 |
| 2020 | $13,893 | $225,264 | $47,628 | $177,636 |
| 2019 | $15,304 | $218,916 | $46,286 | $172,630 |
| 2018 | $14,482 | $199,322 | $45,268 | $154,054 |
| 2017 | $14,264 | $194,176 | $44,099 | $150,077 |
| 2016 | $14,240 | $189,996 | $43,150 | $146,846 |
| 2015 | $15,872 | $182,688 | $41,490 | $141,198 |
| 2014 | $15,872 | $195,789 | $41,490 | $154,299 |
| 2013 | $15,872 | $195,789 | $41,490 | $154,299 |
Source: Public Records
Map
Nearby Homes
- 1736 Robert Ln
- 1804 Princess Cir
- 2255 Wendt Cir
- 3616 Eliot Ln
- 4007 Heron Ct Unit 1
- 1112 Saratoga Ct
- 29W316 Andermann Dr
- 3816 Rosada Dr
- 3432 Caine Dr
- 2711 Wait Rd
- 1116 Hollingswood Ave
- 3508 Tussell St
- 1987 Baldwin Way
- 164 Willow Bend
- 620 Redtop Way
- 3004 Bennett Dr
- 620 Switchgrass Way Unit 61006
- 2339 Ryegrass Ln Unit 64005
- 2335 Ryegrass Ln Unit 64004
- 668 Switchgrass Way Unit 58004
- 1804 Robert Ln
- 1816 Robert Ln
- 1915 Wicklow Rd Unit 1
- 1740 Robert Ln
- 1807 Robert Ln
- 1919 Wicklow Rd
- 1811 Robert Ln Unit 1
- 1803 Robert Ln Unit 3
- 1907 Wicklow Rd
- 1820 Robert Ln
- 1923 Wicklow Rd
- 1828 Robert Ln
- 4207 Halifax Ct
- 4212 Halifax Ct
- 1732 Robert Ln
- 1824 Robert Ln Unit 1
- 1927 Wicklow Rd
- 1903 Wicklow Rd
- 4392 Camelot Cir
- 1828 Princess Cir Unit 3