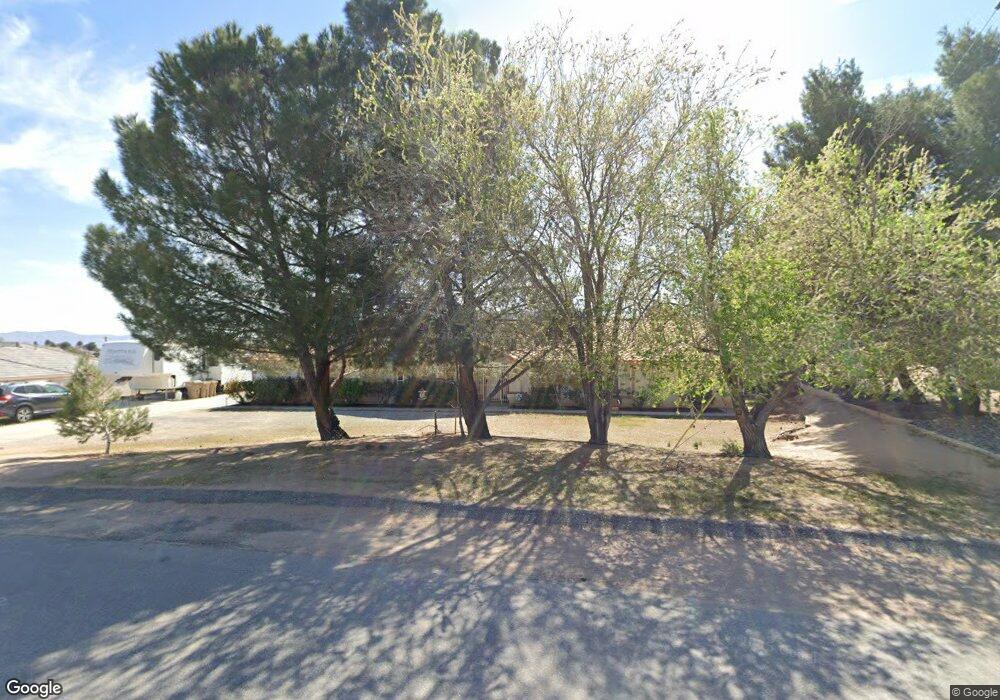
18091 Palm Dr Hesperia, CA 92345
The Mesa NeighborhoodEstimated Value: $449,000 - $524,000
3
Beds
2
Baths
2,046
Sq Ft
$234/Sq Ft
Est. Value
About This Home
This home is located at 18091 Palm Dr, Hesperia, CA 92345 and is currently estimated at $478,181, approximately $233 per square foot. 18091 Palm Dr is a home located in San Bernardino County with nearby schools including Lime Street Elementary School, Ranchero Middle School, and Sultana High School.
Ownership History
Date
Name
Owned For
Owner Type
Purchase Details
Closed on
Nov 6, 2002
Sold by
Bebber Cheryl L
Bought by
Bebber Jim
Current Estimated Value
Home Financials for this Owner
Home Financials are based on the most recent Mortgage that was taken out on this home.
Original Mortgage
$147,900
Interest Rate
5.89%
Mortgage Type
VA
Purchase Details
Closed on
Sep 12, 2002
Sold by
Bebber Jim
Bought by
Booth Jon and Booth Sherri
Home Financials for this Owner
Home Financials are based on the most recent Mortgage that was taken out on this home.
Original Mortgage
$147,900
Interest Rate
5.89%
Mortgage Type
VA
Purchase Details
Closed on
Mar 15, 2001
Sold by
Ward Karol Lynn A
Bought by
Bebber Jim
Purchase Details
Closed on
Oct 1, 2000
Sold by
Ward H K Bud
Bought by
Ward Horace K and Ward Karol Lynn A
Purchase Details
Closed on
May 27, 1997
Sold by
Ward Lynn A
Bought by
Ward H K Bud
Create a Home Valuation Report for This Property
The Home Valuation Report is an in-depth analysis detailing your home's value as well as a comparison with similar homes in the area
Home Values in the Area
Average Home Value in this Area
Purchase History
| Date | Buyer | Sale Price | Title Company |
|---|---|---|---|
| Bebber Jim | -- | First American | |
| Booth Jon | $145,000 | First American | |
| Bebber Jim | -- | First American Title Ins Co | |
| Ward Horace K | -- | -- | |
| Ward H K Bud | -- | First American Title Ins Co |
Source: Public Records
Mortgage History
| Date | Status | Borrower | Loan Amount |
|---|---|---|---|
| Previous Owner | Booth Jon | $147,900 |
Source: Public Records
Tax History Compared to Growth
Tax History
| Year | Tax Paid | Tax Assessment Tax Assessment Total Assessment is a certain percentage of the fair market value that is determined by local assessors to be the total taxable value of land and additions on the property. | Land | Improvement |
|---|---|---|---|---|
| 2025 | $2,308 | $210,011 | $35,701 | $174,310 |
| 2024 | $2,308 | $205,893 | $35,001 | $170,892 |
| 2023 | $2,283 | $201,856 | $34,315 | $167,541 |
| 2022 | $2,231 | $197,898 | $33,642 | $164,256 |
| 2021 | $2,191 | $194,017 | $32,982 | $161,035 |
| 2020 | $2,165 | $192,028 | $32,644 | $159,384 |
| 2019 | $2,121 | $188,263 | $32,004 | $156,259 |
| 2018 | $2,080 | $184,571 | $31,376 | $153,195 |
| 2017 | $2,044 | $180,952 | $30,761 | $150,191 |
| 2016 | $2,001 | $177,404 | $30,158 | $147,246 |
| 2015 | $1,976 | $174,739 | $29,705 | $145,034 |
| 2014 | $1,949 | $171,316 | $29,123 | $142,193 |
Source: Public Records
Map
Nearby Homes
- 18124 Westlawn St
- 18016 Westlawn St
- 18236 Danbury Ave
- 18169 Danbury Ave
- 18303 Westlawn St
- 18221 Orange St
- 18146 Orange St
- 17788 Buckthorn Ave
- 18401 Westlawn St
- 8925 Buckthorn Ave
- 8871 Avocado Ave
- 18403 Danbury Ave
- 8951 Grapefruit Ave
- 8960 Buckthorn Ave
- 8937 Sumac Ave
- 8926 Avocado Ave
- 18524 Hinton St
- 0 Hinton St Unit CV25079446
- 8167 Windsor Ave
- 0 Westlawn St Unit HD25233567
- 18083 Palm Dr
- 18177 Bangor Ct
- 18181 Bangor Ct
- 18175 Bangor Ct
- 18090 Palm Dr
- 18082 Palm Dr
- 18077 Palm Dr
- 18189 Bangor Ct
- 18069 Bangor Ave
- 18166 Bangor Ave
- 18118 Bangor Ave
- 18118 Bangor Ct
- 18197 Bangor Ct
- 18102 Bangor Ave
- 18060 Palm Dr
- 18186 Bangor Ave
- 18067 Palm Dr
- 18067 Bangor Ave
- 18193 Bangor Ct
- 18196 Bangor Ave