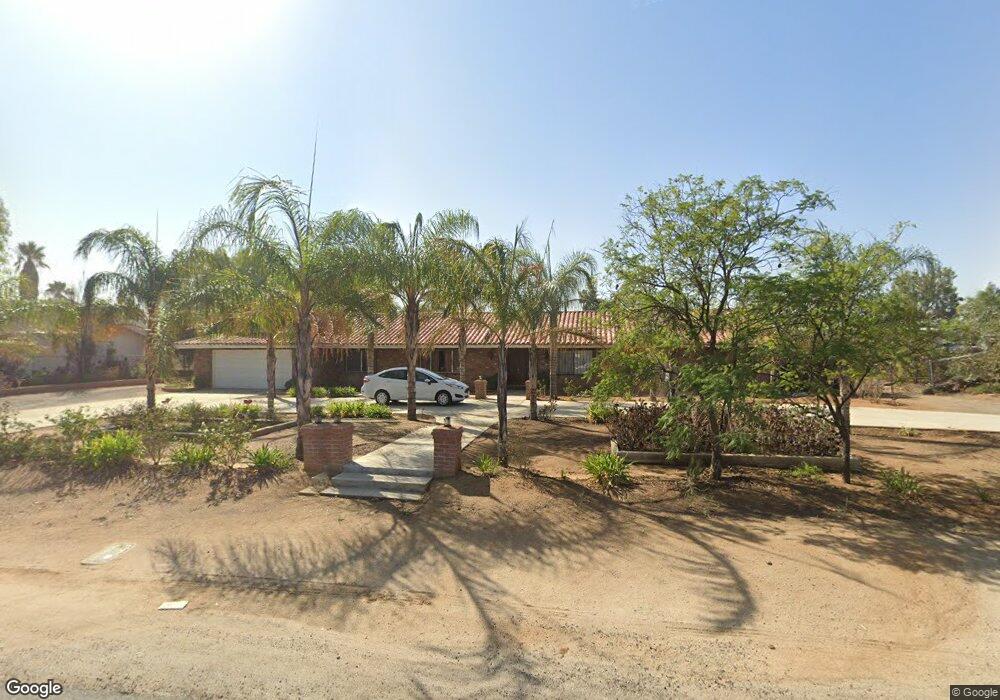
18099 John F. Kennedy Dr Riverside, CA 92508
Estimated Value: $845,374 - $997,000
5
Beds
3
Baths
2,672
Sq Ft
$339/Sq Ft
Est. Value
About This Home
This home is located at 18099 John F. Kennedy Dr, Riverside, CA 92508 and is currently estimated at $905,344, approximately $338 per square foot. 18099 John F. Kennedy Dr is a home located in Riverside County with nearby schools including Frank Augustus Miller Middle School, Martin Luther King Junior High School, and Woodcrest Christian.
Ownership History
Date
Name
Owned For
Owner Type
Purchase Details
Closed on
Aug 26, 2019
Sold by
Padilla Jesus B and Padilla Amelia C
Bought by
Padilla Jesus B and Padilla Amelia C
Current Estimated Value
Purchase Details
Closed on
Apr 19, 2005
Sold by
Padilla Celina and Padilla Maria D
Bought by
Padilla Jesus B and Padilla Amelia C
Home Financials for this Owner
Home Financials are based on the most recent Mortgage that was taken out on this home.
Original Mortgage
$148,000
Outstanding Balance
$112,367
Interest Rate
5.99%
Mortgage Type
Fannie Mae Freddie Mac
Estimated Equity
$792,977
Purchase Details
Closed on
Dec 14, 1993
Sold by
Padilla Jesus B and Padilla Amelia C
Bought by
Padilla Jesus B and Padilla Amelia C
Home Financials for this Owner
Home Financials are based on the most recent Mortgage that was taken out on this home.
Original Mortgage
$146,000
Interest Rate
7.09%
Mortgage Type
Purchase Money Mortgage
Create a Home Valuation Report for This Property
The Home Valuation Report is an in-depth analysis detailing your home's value as well as a comparison with similar homes in the area
Home Values in the Area
Average Home Value in this Area
Purchase History
| Date | Buyer | Sale Price | Title Company |
|---|---|---|---|
| Padilla Jesus B | -- | None Available | |
| Padilla Jesus B | -- | Alliance Title Company | |
| Padilla Jesus B | -- | Fidelity National Title |
Source: Public Records
Mortgage History
| Date | Status | Borrower | Loan Amount |
|---|---|---|---|
| Open | Padilla Jesus B | $148,000 | |
| Previous Owner | Padilla Jesus B | $146,000 |
Source: Public Records
Tax History Compared to Growth
Tax History
| Year | Tax Paid | Tax Assessment Tax Assessment Total Assessment is a certain percentage of the fair market value that is determined by local assessors to be the total taxable value of land and additions on the property. | Land | Improvement |
|---|---|---|---|---|
| 2025 | $3,266 | $310,042 | $95,682 | $214,360 |
| 2023 | $3,266 | $298,004 | $91,967 | $206,037 |
| 2022 | $3,175 | $292,162 | $90,164 | $201,998 |
| 2021 | $3,116 | $286,435 | $88,397 | $198,038 |
| 2020 | $3,091 | $283,499 | $87,491 | $196,008 |
| 2019 | $3,030 | $277,941 | $85,776 | $192,165 |
| 2018 | $2,968 | $272,493 | $84,096 | $188,397 |
| 2017 | $2,913 | $267,151 | $82,448 | $184,703 |
| 2016 | $2,721 | $261,914 | $80,832 | $181,082 |
| 2015 | $2,683 | $257,982 | $79,619 | $178,363 |
| 2014 | $2,656 | $252,930 | $78,060 | $174,870 |
Source: Public Records
Map
Nearby Homes
- 18561 Bert Rd
- 1126 Brasado Way
- 1137 Pamplona Dr
- 18460 Hibiscus Ave
- 14392 Merlot Ct
- 14787 Wood Rd
- 19131 Camassia Ct
- 18090 Iris Ave
- 19138 Kangnam Rd
- 14143 Ashton Ln
- 18118 Iris Ave
- 15868 Shorb St
- 18200 Van Buren Blvd
- 17295 Ridge Canyon Dr
- 0 Colt St
- 15925 Winchester Way
- 0 Van Buren Blvd Unit CV15022911
- 8004 Palm View Ln
- 338 Eternal Way
- 8682 Barnwood Ln
- 18113 John F. Kennedy Dr
- 18085 John F. Kennedy Dr
- 18210 John F. Kennedy Dr
- 18230 John F. Kennedy Dr
- 18071 John F. Kennedy Dr
- 18190 Roberts Rd
- 18266 Roberts Rd
- 18240 Roberts Rd
- 18142 Roberts Rd
- 18057 John F. Kennedy Dr
- 18310 John F. Kennedy Dr
- 18231 Roberts Rd
- 18290 Roberts Rd
- 14930 Sunrise Hill Rd
- 18315 John F. Kennedy Dr
- 18201 Roberts Rd
- 18173 Roberts Rd
- 18120 Roberts Rd
- 18043 John F. Kennedy Dr
- 18115 Roberts Rd