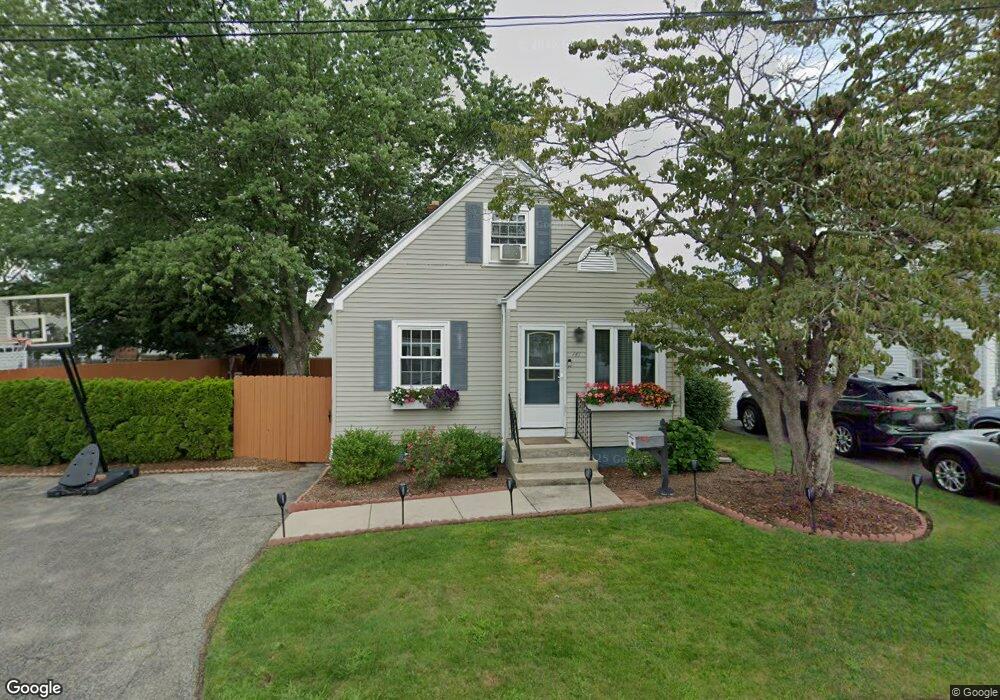
181 Chandler Ave Cranston, RI 02910
Stadium NeighborhoodEstimated Value: $367,000 - $388,000
3
Beds
1
Bath
1,104
Sq Ft
$342/Sq Ft
Est. Value
About This Home
This home is located at 181 Chandler Ave, Cranston, RI 02910 and is currently estimated at $377,809, approximately $342 per square foot. 181 Chandler Ave is a home located in Providence County with nearby schools including Stadium Elementary School, Hugh B. Bain Middle School, and Cranston High School East.
Ownership History
Date
Name
Owned For
Owner Type
Purchase Details
Closed on
Jun 25, 2020
Sold by
Namake Leah M
Bought by
Flores-Flores Rudy M and Deleon-Ramirez Sindy
Current Estimated Value
Home Financials for this Owner
Home Financials are based on the most recent Mortgage that was taken out on this home.
Original Mortgage
$221,338
Outstanding Balance
$196,199
Interest Rate
3.2%
Mortgage Type
FHA
Estimated Equity
$181,610
Create a Home Valuation Report for This Property
The Home Valuation Report is an in-depth analysis detailing your home's value as well as a comparison with similar homes in the area
Home Values in the Area
Average Home Value in this Area
Purchase History
| Date | Buyer | Sale Price | Title Company |
|---|---|---|---|
| Flores-Flores Rudy M | $225,422 | None Available |
Source: Public Records
Mortgage History
| Date | Status | Borrower | Loan Amount |
|---|---|---|---|
| Open | Flores-Flores Rudy M | $221,338 |
Source: Public Records
Tax History Compared to Growth
Tax History
| Year | Tax Paid | Tax Assessment Tax Assessment Total Assessment is a certain percentage of the fair market value that is determined by local assessors to be the total taxable value of land and additions on the property. | Land | Improvement |
|---|---|---|---|---|
| 2025 | $4,232 | $304,900 | $96,600 | $208,300 |
| 2024 | $4,057 | $298,100 | $96,600 | $201,500 |
| 2023 | $4,041 | $213,800 | $66,600 | $147,200 |
| 2022 | $3,957 | $213,800 | $66,600 | $147,200 |
| 2021 | $3,848 | $213,800 | $66,600 | $147,200 |
| 2020 | $3,477 | $167,400 | $63,300 | $104,100 |
| 2019 | $3,477 | $167,400 | $63,300 | $104,100 |
| 2018 | $3,397 | $167,400 | $63,300 | $104,100 |
| 2017 | $3,062 | $133,500 | $46,600 | $86,900 |
| 2016 | $2,997 | $133,500 | $46,600 | $86,900 |
| 2015 | $2,997 | $133,500 | $46,600 | $86,900 |
| 2014 | $2,517 | $133,700 | $46,600 | $87,100 |
Source: Public Records
Map
Nearby Homes
- 179 Chandler Ave
- 191 Chandler Ave
- 168 Fiat Ave
- 162 Fiat Ave
- 186 Fiat Ave
- 173 Chandler Ave
- 184 Chandler Ave
- 158 Fiat Ave
- 197 Chandler Ave
- 180 Chandler Ave
- 192 Chandler Ave
- 176 Chandler Ave
- 152 Fiat Ave
- 169 Chandler Ave
- 196 Chandler Ave
- 172 Chandler Ave
- 190 Fiat Ave
- 181 Westcott Ave
- 173 Westcott Ave
- 181 Fiat Ave