Estimated Value: $1,179,201
Studio
--
Bath
3,876
Sq Ft
$304/Sq Ft
Est. Value
About This Home
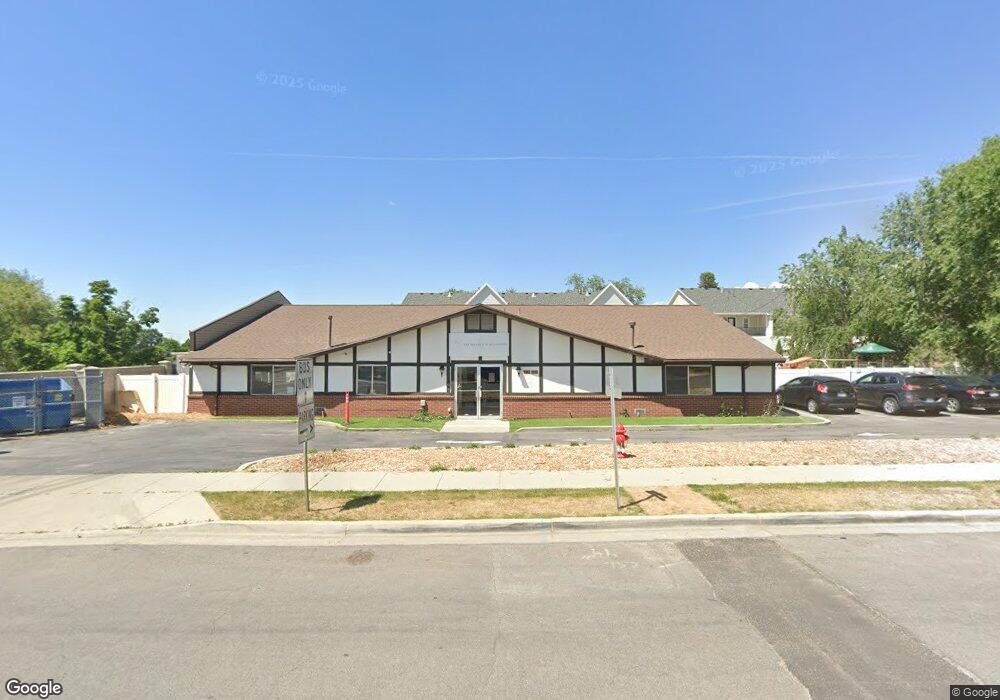
This home is located at 181 E 8960 S, Sandy, UT 84070 and is currently estimated at $1,179,201, approximately $304 per square foot. 181 E 8960 S is a home located in Salt Lake County with nearby schools including Sandy Elementary School, Mount Jordan Middle School, and Jordan High.
Ownership History
Date
Name
Owned For
Owner Type
Purchase Details
Closed on
Jun 27, 2024
Sold by
Montesorri Of Sandy Llc
Bought by
Preschool 181 Llc
Current Estimated Value
Home Financials for this Owner
Home Financials are based on the most recent Mortgage that was taken out on this home.
Original Mortgage
$1,011,680
Outstanding Balance
$1,002,508
Interest Rate
10%
Mortgage Type
Seller Take Back
Estimated Equity
$176,693
Purchase Details
Closed on
Jan 23, 2013
Sold by
Ahluwalia Sunita
Bought by
Montesorri Of Sandy Llc
Home Financials for this Owner
Home Financials are based on the most recent Mortgage that was taken out on this home.
Original Mortgage
$350,000
Interest Rate
3.28%
Mortgage Type
Commercial
Purchase Details
Closed on
Jun 1, 2011
Sold by
Utley Land Investments Co Llc
Bought by
Ahluwalia Sunita
Home Financials for this Owner
Home Financials are based on the most recent Mortgage that was taken out on this home.
Original Mortgage
$350,000
Interest Rate
3.28%
Mortgage Type
Commercial
Create a Home Valuation Report for This Property
The Home Valuation Report is an in-depth analysis detailing your home's value as well as a comparison with similar homes in the area
Home Values in the Area
Average Home Value in this Area
Purchase History
| Date | Buyer | Sale Price | Title Company |
|---|---|---|---|
| Preschool 181 Llc | -- | Truly Title | |
| Montesorri Of Sandy Llc | -- | Mountain View Title & Escrow | |
| Ahluwalia Sunita | -- | Mountain View Title & Escrow | |
| Utley Land Investment Company Llc | -- | Guardian Title | |
| Utley Land Investment Company Llc | -- | Guardian Title |
Source: Public Records
Mortgage History
| Date | Status | Borrower | Loan Amount |
|---|---|---|---|
| Open | Preschool 181 Llc | $1,011,680 | |
| Previous Owner | Montesorri Of Sandy Llc | $350,000 | |
| Previous Owner | Ahluwalia Sunita | $350,000 |
Source: Public Records
Tax History
| Year | Tax Paid | Tax Assessment Tax Assessment Total Assessment is a certain percentage of the fair market value that is determined by local assessors to be the total taxable value of land and additions on the property. | Land | Improvement |
|---|---|---|---|---|
| 2025 | $1,421 | $1,019,400 | $249,500 | $769,900 |
| 2024 | $1,421 | $538,800 | $173,200 | $365,600 |
| 2023 | -- | $489,700 | $163,700 | $326,000 |
| 2022 | $0 | $445,200 | $137,600 | $307,600 |
| 2021 | $2,715 | $423,000 | $128,500 | $294,500 |
| 2020 | $5,279 | $419,800 | $121,000 | $298,800 |
| 2019 | $5,310 | $411,500 | $121,000 | $290,500 |
| 2016 | $19 | $395,600 | $71,200 | $324,400 |
Source: Public Records
Map
Nearby Homes
- 181 E 9180 S
- 8558 S Center St
- 362 E 9150 S
- 270 E 8680 S
- 112 E 8680 S
- 412 E 8760 S
- 220 E Pioneer Ave
- 194 Pioneer Ave
- 149 E Pioneer Ave
- 37 Crawford Place
- 87 W 8710 S
- 87 Pioneer Ave
- 487 E 9270 S
- 136 W Freedom Ave Unit 136
- 8732 S 620 E
- 8470 Solar Way
- 227 E St Germain Way
- 8459 S 300 E
- 140 W 8710 S
- 8812 S Stratford Cir
Your Personal Tour Guide
Ask me questions while you tour the home.