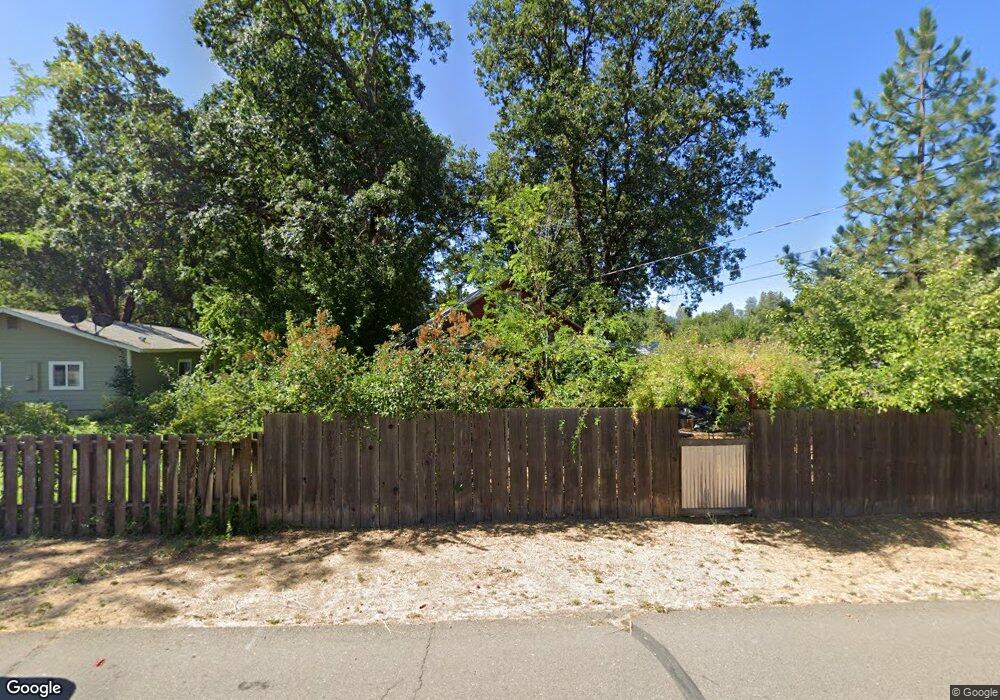
181 Shasta St Hayfork, CA 96041
Estimated Value: $130,000 - $223,184
Studio
--
Bath
--
Sq Ft
0.32
Acres
About This Home
This home is located at 181 Shasta St, Hayfork, CA 96041 and is currently estimated at $174,728. 181 Shasta St is a home with nearby schools including Hayfork High School.
Ownership History
Date
Name
Owned For
Owner Type
Purchase Details
Closed on
Sep 10, 2021
Sold by
Allan Jeffrey M and Allan Emily G
Bought by
Allan Jeffrey M and Allan Emily G
Current Estimated Value
Purchase Details
Closed on
May 10, 2006
Sold by
Seastrunk Roger N
Bought by
Allan Jeffrey M and Allan Emily G
Home Financials for this Owner
Home Financials are based on the most recent Mortgage that was taken out on this home.
Original Mortgage
$51,500
Outstanding Balance
$29,929
Interest Rate
6.46%
Mortgage Type
Fannie Mae Freddie Mac
Estimated Equity
$144,799
Create a Home Valuation Report for This Property
The Home Valuation Report is an in-depth analysis detailing your home's value as well as a comparison with similar homes in the area
Home Values in the Area
Average Home Value in this Area
Purchase History
| Date | Buyer | Sale Price | Title Company |
|---|---|---|---|
| Allan Jeffrey M | -- | None Available | |
| Allan Jeffrey M | $81,500 | Trinity Co Title Co |
Source: Public Records
Mortgage History
| Date | Status | Borrower | Loan Amount |
|---|---|---|---|
| Open | Allan Jeffrey M | $51,500 |
Source: Public Records
Tax History
| Year | Tax Paid | Tax Assessment Tax Assessment Total Assessment is a certain percentage of the fair market value that is determined by local assessors to be the total taxable value of land and additions on the property. | Land | Improvement |
|---|---|---|---|---|
| 2025 | $1,378 | $111,354 | $47,820 | $63,534 |
| 2024 | $1,361 | $109,172 | $46,883 | $62,289 |
| 2023 | $1,361 | $107,032 | $45,964 | $61,068 |
| 2022 | $1,336 | $104,934 | $45,063 | $59,871 |
| 2021 | $1,322 | $102,878 | $44,180 | $58,698 |
| 2020 | $1,278 | $101,824 | $43,727 | $58,097 |
| 2019 | $1,226 | $99,828 | $42,870 | $56,958 |
| 2018 | $1,226 | $97,872 | $42,030 | $55,842 |
| 2017 | $1,223 | $95,954 | $41,206 | $54,748 |
| 2016 | $1,185 | $94,074 | $40,399 | $53,675 |
| 2015 | $1,172 | $92,662 | $39,793 | $52,869 |
| 2014 | $1,160 | $90,848 | $39,014 | $51,834 |
Source: Public Records
Map
Nearby Homes
Your Personal Tour Guide
Ask me questions while you tour the home.