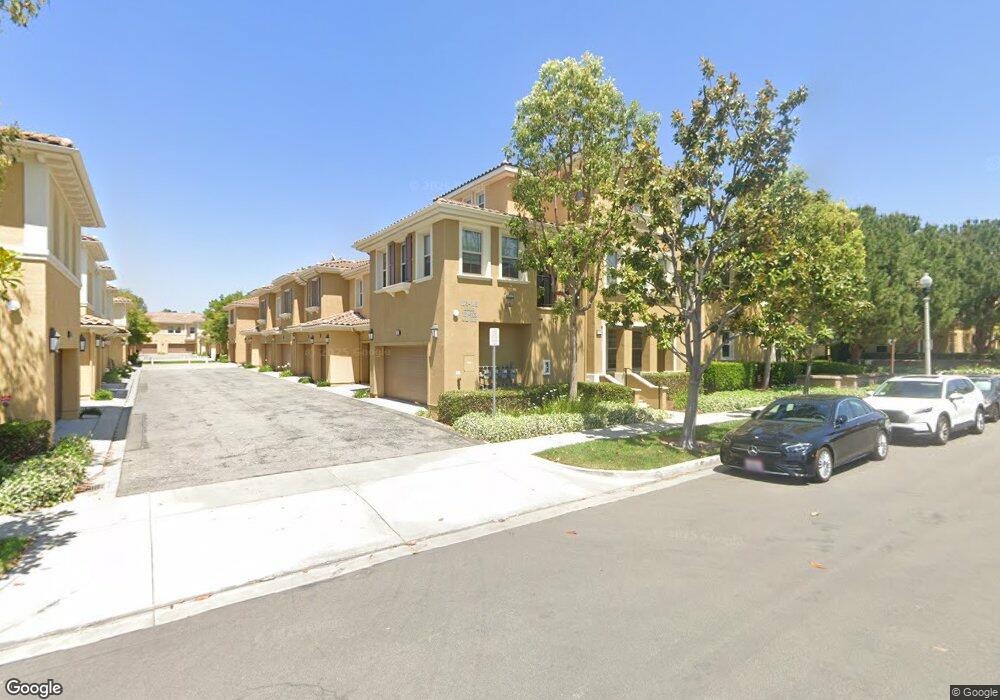
181 Wild Lilac Irvine, CA 92620
Woodbury and Stonegate NeighborhoodEstimated Value: $1,119,000 - $1,268,000
2
Beds
3
Baths
1,364
Sq Ft
$867/Sq Ft
Est. Value
About This Home
This home is located at 181 Wild Lilac, Irvine, CA 92620 and is currently estimated at $1,182,305, approximately $866 per square foot. 181 Wild Lilac is a home located in Orange County with nearby schools including Jeffrey Trail Middle, Portola High School, and New Horizon Elementary School.
Ownership History
Date
Name
Owned For
Owner Type
Purchase Details
Closed on
Aug 4, 2015
Sold by
Yun Jaewon and Yun Christine
Bought by
Yun Jaewon and Yun Christine
Current Estimated Value
Home Financials for this Owner
Home Financials are based on the most recent Mortgage that was taken out on this home.
Original Mortgage
$288,441
Outstanding Balance
$114,004
Interest Rate
3.98%
Mortgage Type
New Conventional
Estimated Equity
$1,068,301
Purchase Details
Closed on
Sep 16, 2011
Sold by
Peters Teresa M
Bought by
Yun Jaewon and Trang Christine
Home Financials for this Owner
Home Financials are based on the most recent Mortgage that was taken out on this home.
Original Mortgage
$324,000
Interest Rate
4.01%
Mortgage Type
New Conventional
Purchase Details
Closed on
Nov 15, 2006
Sold by
William Lyon Homes Inc
Bought by
Peters Teresa M
Home Financials for this Owner
Home Financials are based on the most recent Mortgage that was taken out on this home.
Original Mortgage
$495,600
Interest Rate
6.5%
Mortgage Type
New Conventional
Create a Home Valuation Report for This Property
The Home Valuation Report is an in-depth analysis detailing your home's value as well as a comparison with similar homes in the area
Home Values in the Area
Average Home Value in this Area
Purchase History
| Date | Buyer | Sale Price | Title Company |
|---|---|---|---|
| Yun Jaewon | -- | First American Title Company | |
| Yun Jaewon | $405,000 | Orange Coast Title | |
| Peters Teresa M | $620,000 | Fidelity National Title-Buil |
Source: Public Records
Mortgage History
| Date | Status | Borrower | Loan Amount |
|---|---|---|---|
| Open | Yun Jaewon | $288,441 | |
| Closed | Yun Jaewon | $324,000 | |
| Previous Owner | Peters Teresa M | $495,600 |
Source: Public Records
Tax History Compared to Growth
Tax History
| Year | Tax Paid | Tax Assessment Tax Assessment Total Assessment is a certain percentage of the fair market value that is determined by local assessors to be the total taxable value of land and additions on the property. | Land | Improvement |
|---|---|---|---|---|
| 2025 | $8,143 | $508,697 | $297,056 | $211,641 |
| 2024 | $8,143 | $498,723 | $291,231 | $207,492 |
| 2023 | $7,985 | $488,945 | $285,521 | $203,424 |
| 2022 | $7,848 | $479,358 | $279,922 | $199,436 |
| 2021 | $7,722 | $469,959 | $274,433 | $195,526 |
| 2020 | $7,615 | $465,141 | $271,619 | $193,522 |
| 2019 | $8,060 | $456,021 | $266,293 | $189,728 |
| 2018 | $7,937 | $447,080 | $261,072 | $186,008 |
| 2017 | $7,839 | $438,314 | $255,953 | $182,361 |
| 2016 | $7,908 | $429,720 | $250,934 | $178,786 |
| 2015 | $7,810 | $423,266 | $247,165 | $176,101 |
| 2014 | $7,723 | $414,975 | $242,323 | $172,652 |
Source: Public Records
Map
Nearby Homes
- 185 Wild Lilac
- 187 Wild Lilac
- 107 Rinaldi
- 191 Wild Lilac
- 103 Rinaldi
- 193 Wild Lilac
- 197 Wild Lilac
- 199 Wild Lilac
- 106 Rinaldi
- 203 Wild Lilac
- 186 Wild Lilac
- 182 Wild Lilac Unit 31
- 184 Wild Lilac
- 190 Wild Lilac Unit 27
- 188 Wild Lilac Unit 28
- 180 Wild Lilac
- 205 Wild Lilac
- 192 Wild Lilac
- 104 Rinaldi Unit 67
- 189 Wild Lilac