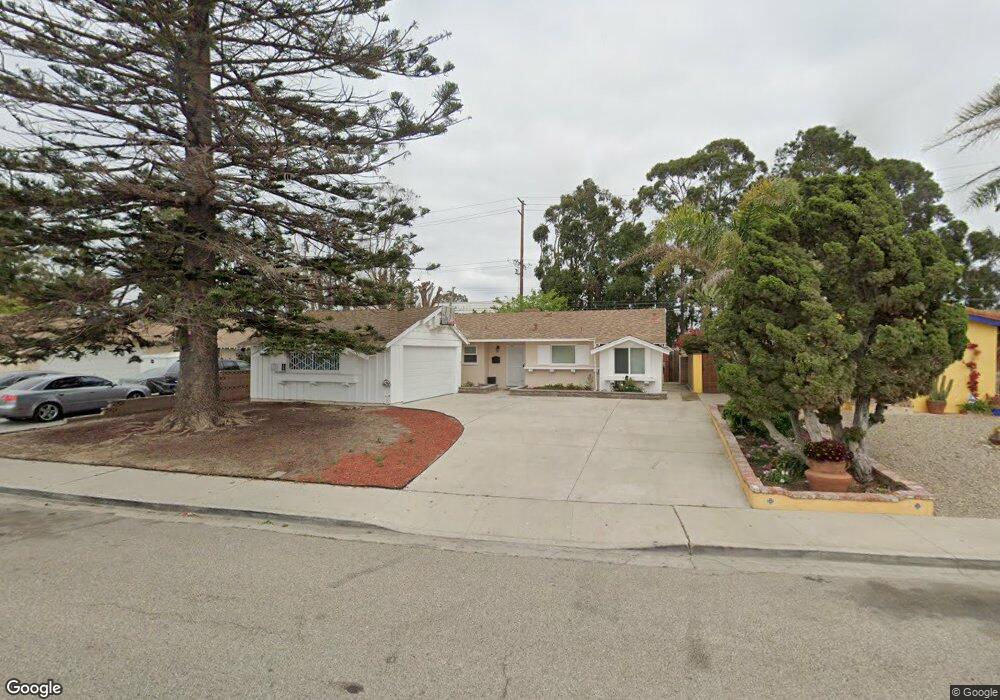
1810 Arcadia St Oxnard, CA 93033
Cal-Gisler NeighborhoodEstimated Value: $662,000 - $806,000
3
Beds
2
Baths
1,393
Sq Ft
$516/Sq Ft
Est. Value
About This Home
This home is located at 1810 Arcadia St, Oxnard, CA 93033 and is currently estimated at $718,373, approximately $515 per square foot. 1810 Arcadia St is a home with nearby schools including Elm Street Elementary School, R.J. Frank Academy of Marine Science & Engineering, and Santa Clara High School.
Ownership History
Date
Name
Owned For
Owner Type
Purchase Details
Closed on
Jul 15, 2019
Sold by
Coleman Kent L and Coleman Barbara L
Bought by
Coleman Kent L and Coleman Barbara
Current Estimated Value
Home Financials for this Owner
Home Financials are based on the most recent Mortgage that was taken out on this home.
Original Mortgage
$1,900,000
Outstanding Balance
$1,661,473
Interest Rate
3.73%
Mortgage Type
Unknown
Estimated Equity
-$943,100
Purchase Details
Closed on
Jun 22, 2019
Sold by
Coleman Kent L and Coleman Barbara L
Bought by
Beautiful Coast Management Llc
Home Financials for this Owner
Home Financials are based on the most recent Mortgage that was taken out on this home.
Original Mortgage
$1,900,000
Outstanding Balance
$1,661,473
Interest Rate
3.73%
Mortgage Type
Unknown
Estimated Equity
-$943,100
Purchase Details
Closed on
Oct 11, 2002
Sold by
Coleman Kent L and Barbara Coleman L
Bought by
Coleman Kent L and Barbara Coleman L
Create a Home Valuation Report for This Property
The Home Valuation Report is an in-depth analysis detailing your home's value as well as a comparison with similar homes in the area
Home Values in the Area
Average Home Value in this Area
Purchase History
| Date | Buyer | Sale Price | Title Company |
|---|---|---|---|
| Coleman Kent L | -- | None Available | |
| Beautiful Coast Management Llc | -- | None Available | |
| Coleman Kent L | -- | -- |
Source: Public Records
Mortgage History
| Date | Status | Borrower | Loan Amount |
|---|---|---|---|
| Open | Coleman Kent L | $1,900,000 |
Source: Public Records
Tax History
| Year | Tax Paid | Tax Assessment Tax Assessment Total Assessment is a certain percentage of the fair market value that is determined by local assessors to be the total taxable value of land and additions on the property. | Land | Improvement |
|---|---|---|---|---|
| 2025 | $2,229 | $180,295 | $54,588 | $125,707 |
| 2024 | $2,229 | $176,760 | $53,517 | $123,243 |
| 2023 | $2,149 | $173,295 | $52,468 | $120,827 |
| 2022 | $2,086 | $169,898 | $51,440 | $118,458 |
| 2021 | $2,070 | $166,567 | $50,431 | $116,136 |
| 2020 | $2,107 | $164,862 | $49,915 | $114,947 |
| 2019 | $2,049 | $161,631 | $48,937 | $112,694 |
| 2018 | $2,021 | $158,463 | $47,978 | $110,485 |
| 2017 | $1,920 | $155,357 | $47,038 | $108,319 |
| 2016 | $1,854 | $152,312 | $46,116 | $106,196 |
| 2015 | $1,873 | $150,025 | $45,424 | $104,601 |
| 2014 | $1,853 | $147,088 | $44,535 | $102,553 |
Source: Public Records
Map
Nearby Homes
- 558 E Hemlock St
- 225 W Iris St
- 3130 Paula St
- 2151 E Wooley Rd
- 3151 Fournier St
- 1239 S C St
- 1928 San Benito St
- 2024 S J St
- 865 S B St Unit Q1
- 819 S B St Unit 34
- 633 Meta St
- 860 Morro Way
- 3631 La Costa Place
- 360 Ibsen Place Unit 129
- 3638 S B St
- 1030 Ilena St
- 140 Gaviota Place Unit 157
- 4160 Petit Dr Unit 39
- 653 S G St
- 280 Columbia Place Unit 48
- 1800 Arcadia St
- 1820 Arcadia St
- 1830 Arcadia St
- 630 E Fir Ave
- 1730 Arcadia St
- 641 E Guava St
- 1840 Arcadia St
- 620 E Fir Ave
- 1741 Arcadia St
- 629 E Guava St
- 1900 Arcadia St
- 1733 Arcadia St
- 610 E Fir Ave
- 1724 Arcadia St
- 619 E Guava St
- 587 Fir Ct
- 1908 Arcadia St
- 600 E Fir Ave
- 1731 Arcadia St
- 1720 Arcadia St
Your Personal Tour Guide
Ask me questions while you tour the home.