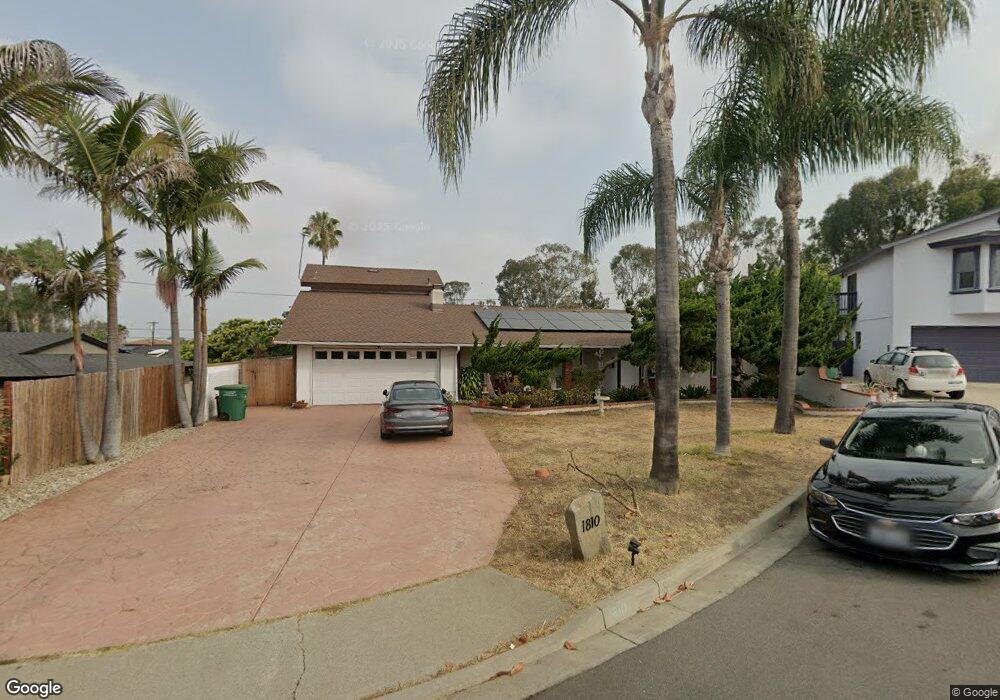
1810 Guevara Rd Carlsbad, CA 92008
Olde Carlsbad NeighborhoodEstimated Value: $1,622,000 - $1,887,000
5
Beds
4
Baths
2,042
Sq Ft
$849/Sq Ft
Est. Value
About This Home
This home is located at 1810 Guevara Rd, Carlsbad, CA 92008 and is currently estimated at $1,734,225, approximately $849 per square foot. 1810 Guevara Rd is a home located in San Diego County with nearby schools including Buena Vista Elementary, Carlsbad High School, and Sage Creek High.
Ownership History
Date
Name
Owned For
Owner Type
Purchase Details
Closed on
Jan 13, 2023
Sold by
King Patricia B
Bought by
King Patricia B and King Steven M
Current Estimated Value
Home Financials for this Owner
Home Financials are based on the most recent Mortgage that was taken out on this home.
Original Mortgage
$110,000
Outstanding Balance
$102,169
Interest Rate
6.48%
Mortgage Type
New Conventional
Estimated Equity
$1,632,056
Purchase Details
Closed on
Jun 21, 2017
Sold by
Moreno Rudy H
Bought by
King Patricia B
Purchase Details
Closed on
Aug 15, 2000
Sold by
Umjt Moreno Mary H and Moreno Rudy H
Bought by
Moreno Rudy H and Moreno Mary H
Create a Home Valuation Report for This Property
The Home Valuation Report is an in-depth analysis detailing your home's value as well as a comparison with similar homes in the area
Home Values in the Area
Average Home Value in this Area
Purchase History
| Date | Buyer | Sale Price | Title Company |
|---|---|---|---|
| King Patricia B | -- | California Members Title Compa | |
| King Patricia B | -- | None Available | |
| Moreno Rudy H | -- | -- |
Source: Public Records
Mortgage History
| Date | Status | Borrower | Loan Amount |
|---|---|---|---|
| Open | King Patricia B | $110,000 |
Source: Public Records
Tax History
| Year | Tax Paid | Tax Assessment Tax Assessment Total Assessment is a certain percentage of the fair market value that is determined by local assessors to be the total taxable value of land and additions on the property. | Land | Improvement |
|---|---|---|---|---|
| 2025 | $1,607 | $145,192 | $35,551 | $109,641 |
| 2024 | $1,607 | $142,346 | $34,854 | $107,492 |
| 2023 | $1,522 | $139,556 | $34,171 | $105,385 |
| 2022 | $1,498 | $136,820 | $33,501 | $103,319 |
| 2021 | $1,486 | $134,139 | $32,845 | $101,294 |
| 2020 | $1,475 | $132,765 | $32,509 | $100,256 |
| 2019 | $1,449 | $130,163 | $31,872 | $98,291 |
| 2018 | $1,389 | $127,612 | $31,248 | $96,364 |
| 2017 | $1,365 | $125,111 | $30,636 | $94,475 |
| 2016 | $1,311 | $122,659 | $30,036 | $92,623 |
| 2015 | $1,304 | $120,817 | $29,585 | $91,232 |
| 2014 | $1,283 | $118,451 | $29,006 | $89,445 |
Source: Public Records
Map
Nearby Homes
- 2645 Highland Dr
- 1351 Forest Ave
- 2829 Forest View Way
- 2038 Avenue of The Trees
- 2245 Ivy Rd
- 3235 Donna Dr
- 2415 Tuttle St
- 2301 Ivy Rd
- 2336 Hosp Way Unit 115
- 2336 Hosp Way Unit 314
- 2332 Hosp Way Unit 207
- 2360 Hosp Way Unit 331
- 2330 Hosp Way Unit 202
- 2380 Hosp Way Unit 139
- 1858 Avocado Rd
- 2525 Jefferson St Unit B
- 2535 Jefferson St Unit 10
- 1773 Ivy Rd
- 1782 Troy Ln
- 1850 Downs St
- 1811 Ratcliff Rd
- 1800 Guevara Rd
- 1812 Guevara Rd
- 1801 Ratcliff Rd
- 1821 Ratcliff Rd
- 1821 & 182 Ratcliff
- 1814 Guevara Rd
- 1798 Guevara Rd
- 1811 Guevara Rd
- 1801 Guevara Rd
- 1799 Ratcliff Rd
- 1821 Guevara Rd
- 1831 Guevara Rd
- 1810 Ratcliff Rd
- 1788 Guevara Rd
- 1799 Guevara Rd
- 1789 Ratcliff Rd
- 1800 Ratcliff Rd
- 1790 Ratcliff Rd
- 1844 Butters Rd
Your Personal Tour Guide
Ask me questions while you tour the home.