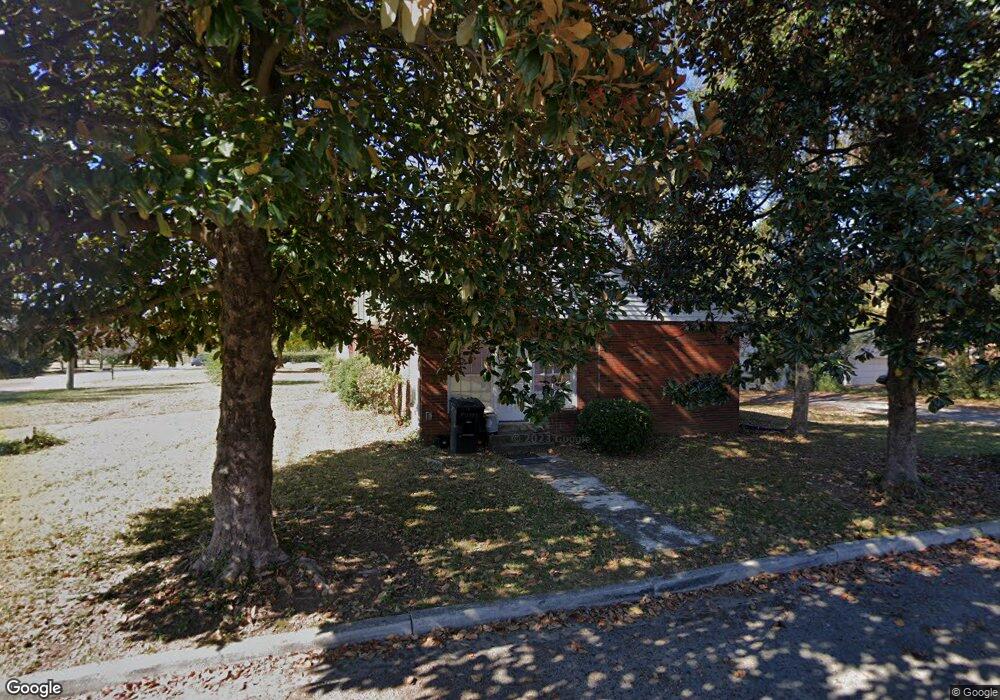
1811 E Main St Murfreesboro, TN 37130
Estimated Value: $318,332 - $485,000
Studio
3
Baths
2,378
Sq Ft
$166/Sq Ft
Est. Value
About This Home
This home is located at 1811 E Main St, Murfreesboro, TN 37130 and is currently estimated at $394,833, approximately $166 per square foot. 1811 E Main St is a home located in Rutherford County with nearby schools including Hobgood Elementary School, Whitworth-Buchanan Middle School, and Oakland High School.
Ownership History
Date
Name
Owned For
Owner Type
Purchase Details
Closed on
Oct 8, 1993
Sold by
Shirlie Hollins
Bought by
Clark Catherine F
Current Estimated Value
Create a Home Valuation Report for This Property
The Home Valuation Report is an in-depth analysis detailing your home's value as well as a comparison with similar homes in the area
Home Values in the Area
Average Home Value in this Area
Purchase History
| Date | Buyer | Sale Price | Title Company |
|---|---|---|---|
| Clark Catherine F | $77,000 | -- |
Source: Public Records
Tax History
| Year | Tax Paid | Tax Assessment Tax Assessment Total Assessment is a certain percentage of the fair market value that is determined by local assessors to be the total taxable value of land and additions on the property. | Land | Improvement |
|---|---|---|---|---|
| 2025 | $3,107 | $109,840 | $19,000 | $90,840 |
| 2024 | $3,107 | $109,840 | $19,000 | $90,840 |
| 2023 | $2,061 | $109,840 | $19,000 | $90,840 |
| 2022 | $1,775 | $109,840 | $19,000 | $90,840 |
| 2021 | $1,627 | $73,320 | $16,000 | $57,320 |
| 2020 | $1,627 | $73,320 | $16,000 | $57,320 |
| 2019 | $1,627 | $73,320 | $16,000 | $57,320 |
| 2018 | $2,235 | $73,320 | $0 | $0 |
| 2017 | $1,804 | $46,400 | $0 | $0 |
| 2016 | $1,804 | $46,400 | $0 | $0 |
| 2015 | $1,804 | $46,400 | $0 | $0 |
| 2014 | $1,154 | $46,400 | $0 | $0 |
| 2013 | -- | $44,800 | $0 | $0 |
Source: Public Records
Map
Nearby Homes
- 1810 Dr Martin Luther King jr Blvd
- 1814 Dr Martin Luther King jr Blvd
- 1511 Diana St
- 726 Kalu Dr
- 2038 Middle Tennessee Blvd
- 434 Hawkins Ave
- 531 Dill Ln Unit A9
- 1302 Doctor Martin Luther King Jr Blvd Unit B 49
- 1302 Doctor Martin Luther King Jr B Unit 1
- 2961 S Rutherford Blvd Unit A1
- 5485 John Bragg Hwy
- 1511 Sherrill Blvd
- 1019 E Main St
- 2519 E Main St
- 1307 Atlas St
- 806 Brookfield Dr
- 1315 Eagle St
- 920 Ewing Blvd
- 802 E Main St Unit 16
- 904 Empire Blvd
- 1807 E Main St
- 1810 Jordan Ave
- 1804 Jordan Ave
- 1903 E Main St
- 1803 E Main St
- 1810 E Main St
- 1800 Jordan Ave
- 1806 E Main St
- 1907 E Main St
- 1912 E Main St
- 1807 Jordan Ave
- 1819 Jordan Ave
- 1821 Jordan Ave
- 1825 Jordan Ave
- 1911 E Main St
- 1725 E Main St
- 1803 Jordan Ave
- 1815 Wilson Ave
- 1815 Jordan Ave
- 1903 Jordan Ave
Your Personal Tour Guide
Ask me questions while you tour the home.