1811 Pullen Rd Sevierville, TN 37862
Estimated Value: $947,303
Studio
12
Baths
7,448
Sq Ft
$127/Sq Ft
Est. Value
About This Home
This home is located at 1811 Pullen Rd, Sevierville, TN 37862 and is currently estimated at $947,303, approximately $127 per square foot. 1811 Pullen Rd is a home located in Sevier County with nearby schools including Christian Academy of the Smokies.
Ownership History
Date
Name
Owned For
Owner Type
Purchase Details
Closed on
Aug 13, 2025
Sold by
Norman And Sarah Ball Family Trust and Ball Norman L
Bought by
Ball Norman L and Ball Sarah O
Current Estimated Value
Purchase Details
Closed on
Jun 13, 2025
Sold by
Norman And Sarah Ball Family Trust and Ball Norman L
Bought by
Ball Family Real Property Map Trust and Ball
Home Financials for this Owner
Home Financials are based on the most recent Mortgage that was taken out on this home.
Original Mortgage
$755,000
Interest Rate
6.76%
Mortgage Type
New Conventional
Purchase Details
Closed on
Jan 16, 2001
Sold by
Ball Norman L and Ball Sarah O
Bought by
Ball Norman L Trustee
Purchase Details
Closed on
Dec 31, 1986
Bought by
Ball Norman and Ball Sarah
Create a Home Valuation Report for This Property
The Home Valuation Report is an in-depth analysis detailing your home's value as well as a comparison with similar homes in the area
Home Values in the Area
Average Home Value in this Area
Purchase History
| Date | Buyer | Sale Price | Title Company |
|---|---|---|---|
| Ball Norman L | -- | None Listed On Document | |
| Ball Family Real Property Map Trust | -- | None Listed On Document | |
| Ball Norman L Trustee | -- | -- | |
| Ball Norman | $2,000 | -- |
Source: Public Records
Mortgage History
| Date | Status | Borrower | Loan Amount |
|---|---|---|---|
| Previous Owner | Ball Family Real Property Map Trust | $755,000 |
Source: Public Records
Tax History
| Year | Tax Paid | Tax Assessment Tax Assessment Total Assessment is a certain percentage of the fair market value that is determined by local assessors to be the total taxable value of land and additions on the property. | Land | Improvement |
|---|---|---|---|---|
| 2025 | $4,190 | $283,080 | $36,200 | $246,880 |
| 2024 | $4,190 | $283,080 | $36,200 | $246,880 |
| 2023 | $4,190 | $283,080 | $0 | $0 |
| 2022 | $4,190 | $283,080 | $36,200 | $246,880 |
| 2021 | $4,190 | $283,080 | $36,200 | $246,880 |
| 2020 | $3,963 | $283,080 | $36,200 | $246,880 |
| 2019 | $3,963 | $213,080 | $35,640 | $177,440 |
| 2018 | $3,963 | $213,080 | $35,640 | $177,440 |
| 2017 | $3,963 | $213,080 | $35,640 | $177,440 |
| 2016 | $3,963 | $213,080 | $35,640 | $177,440 |
| 2015 | -- | $229,360 | $0 | $0 |
| 2014 | $3,739 | $229,376 | $0 | $0 |
Source: Public Records
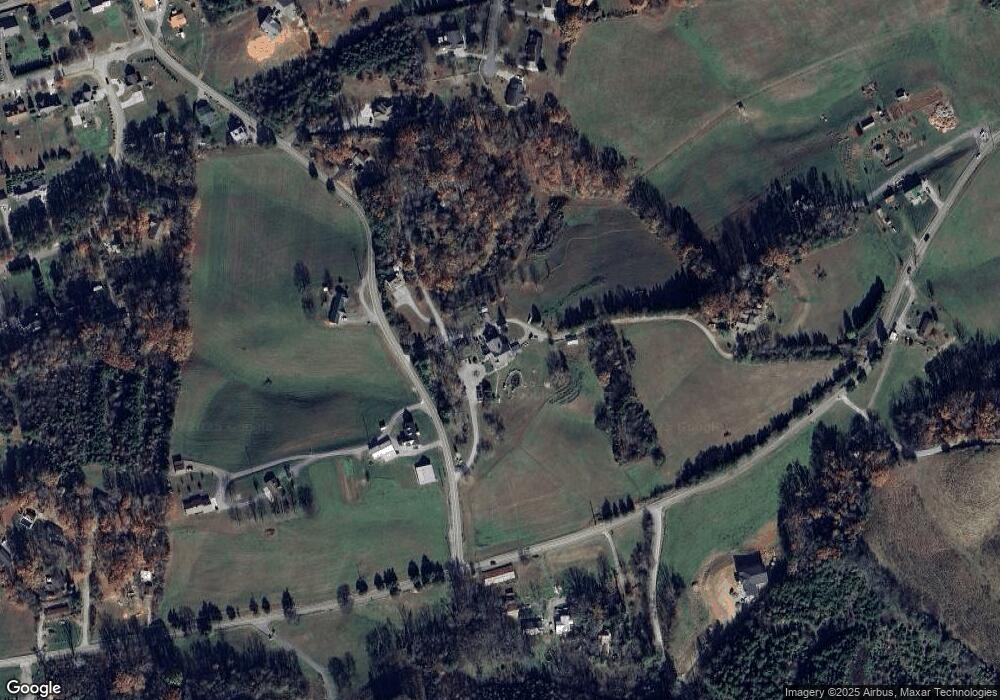
Map
Nearby Homes
- 0000 Jayell Rd
- 3303 Grace Way
- 1356 Jayell Rd
- 1562 Pullen Rd
- 0 Somerset Ln Unit 1261714
- 1825 Newman Town Rd
- Lot 22 Park Place Ave
- 0 Lot 22 Park Place Ave
- 2149 Seaton Springs Rd
- 2234 Green Acres Cir
- 2146 Seaton Springs Rd
- 1945 Valley Woods Dr
- 1409 Katie Ln
- 2001 Tiffany Way
- 1831 Sierra Ln
- Lot 16 Sierra Ln
- 1465 Landmark Blvd
- 1508 Boo Boos Way
- 1511 Landmark Blvd
- 1642 Kissing Way
- 1816 Pullen Rd
- 1727 Pullen Rd
- 1737 Pullen Rd
- 1740 Pullen Rd
- 1533 Jayell Rd
- 1719 Pullen Rd
- 1629 S Dorset Ln
- 1525 Jayell Rd
- 1401 Blue Ridge Way
- 1711 Pullen Rd
- 1418 Jayell Rd
- 0 Jayell Rd Unit 247183
- Lot 7 Jayell Rd
- Lot 6 Jayell Rd
- Lot 4 Jayell Rd
- Lot 5 Jayell Rd
- 0 Jayell Rd
- Lot 7 Jayell Rd Unit 7
- Lot 6 Jayell Rd Unit 6
- Lot 4 Jayell Rd Unit 4
Your Personal Tour Guide
Ask me questions while you tour the home.