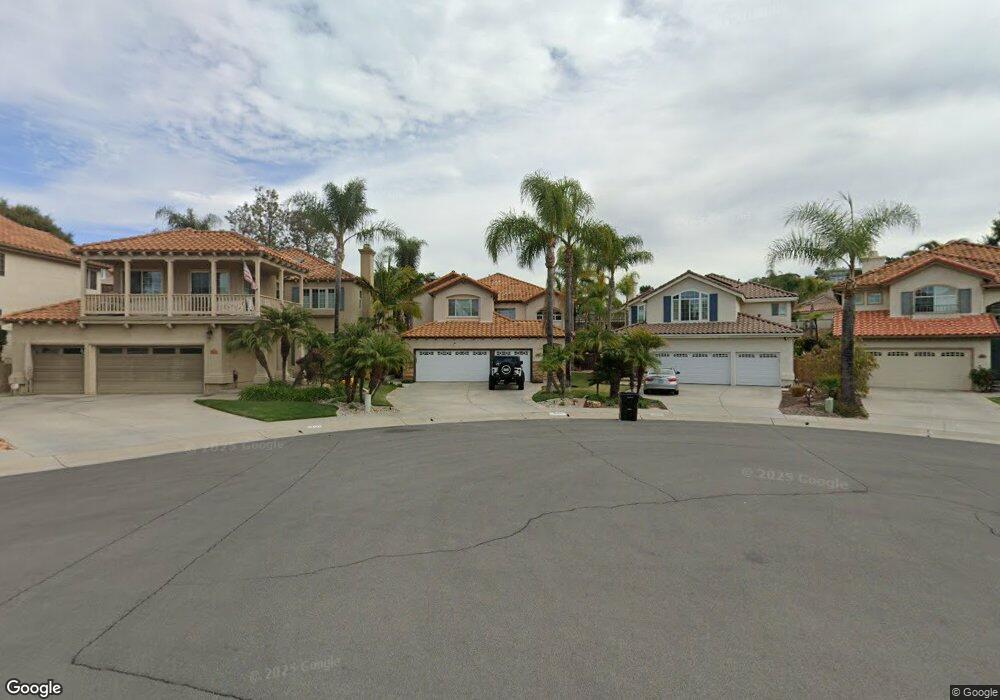
18113 Chieftain Ct Unit 8 San Diego, CA 92127
Rancho Bernardo NeighborhoodEstimated Value: $1,573,000 - $2,098,000
4
Beds
4
Baths
4,031
Sq Ft
$482/Sq Ft
Est. Value
About This Home
This home is located at 18113 Chieftain Ct Unit 8, San Diego, CA 92127 and is currently estimated at $1,941,377, approximately $481 per square foot. 18113 Chieftain Ct Unit 8 is a home located in San Diego County with nearby schools including Westwood Elementary School, Bernardo Heights Middle, and Rancho Bernardo High.
Ownership History
Date
Name
Owned For
Owner Type
Purchase Details
Closed on
Dec 19, 2018
Sold by
Mcintyre Marc and Mcintyre Amanda
Bought by
Mcintyre Marc D and Mcintyre Amanda F
Current Estimated Value
Purchase Details
Closed on
Jul 3, 2003
Sold by
Bromley Charles A and Bromley Michelle F
Bought by
Mcintyre Marc and Mcintyre Amanda
Home Financials for this Owner
Home Financials are based on the most recent Mortgage that was taken out on this home.
Original Mortgage
$59,500
Interest Rate
5.6%
Mortgage Type
Credit Line Revolving
Purchase Details
Closed on
May 28, 1991
Create a Home Valuation Report for This Property
The Home Valuation Report is an in-depth analysis detailing your home's value as well as a comparison with similar homes in the area
Home Values in the Area
Average Home Value in this Area
Purchase History
| Date | Buyer | Sale Price | Title Company |
|---|---|---|---|
| Mcintyre Marc D | -- | None Available | |
| Mcintyre Marc | $595,000 | California Title Company | |
| -- | $281,000 | -- |
Source: Public Records
Mortgage History
| Date | Status | Borrower | Loan Amount |
|---|---|---|---|
| Closed | Mcintyre Marc | $59,500 | |
| Previous Owner | Mcintyre Marc | $476,000 |
Source: Public Records
Tax History Compared to Growth
Tax History
| Year | Tax Paid | Tax Assessment Tax Assessment Total Assessment is a certain percentage of the fair market value that is determined by local assessors to be the total taxable value of land and additions on the property. | Land | Improvement |
|---|---|---|---|---|
| 2025 | $11,155 | $1,073,715 | $241,697 | $832,018 |
| 2024 | $11,155 | $1,052,662 | $236,958 | $815,704 |
| 2023 | $10,915 | $1,032,022 | $232,312 | $799,710 |
| 2022 | $10,751 | $1,011,787 | $227,757 | $784,030 |
| 2021 | $10,554 | $991,949 | $223,292 | $768,657 |
| 2020 | $10,442 | $981,779 | $221,003 | $760,776 |
| 2019 | $10,176 | $962,529 | $216,670 | $745,859 |
| 2018 | $9,893 | $943,657 | $212,422 | $731,235 |
| 2017 | $9,694 | $925,155 | $208,257 | $716,898 |
| 2016 | $9,498 | $907,016 | $204,174 | $702,842 |
| 2015 | $9,356 | $893,393 | $201,108 | $692,285 |
| 2014 | $10,045 | $875,894 | $197,169 | $678,725 |
Source: Public Records
Map
Nearby Homes
- 18103 Smokesignal Dr
- 17892 Creciente Way
- 17924 Cabela Dr
- 11515 Escoba Place
- 17885 Caminito Pinero Unit 255
- 17544 Ashburton Rd
- 11915 Fairhope Rd
- 11364 Poblado Rd
- 11864 Bernardo Terrace Unit C
- 11872 Bernardo Terrace Unit E
- 17165 W Bernardo Dr Unit 205
- 17185 W Bernardo Dr Unit 203
- 17195 W Bernardo Dr Unit 206
- 17141 W Bernardo Dr Unit 204
- 17093 W Bernardo Dr Unit 202
- 17093 W Bernardo Dr Unit 205
- 18650 Caminito Cantilena Unit 291
- 18557 Caminito Pasadero Unit 389
- 18515 Caminito Pasadero Unit 347
- 18752 Caminito Cantilena Unit 176
- 18105 Chieftain Ct
- 18121 Chieftain Ct
- 18097 Chieftain Ct
- 18129 Chieftain Ct
- 17808 Azucar Way Unit 15
- 17816 Azucar Way
- 17716 Creciente Way
- 17722 Creciente Way
- 17798 Azucar Way
- 18091 Chieftain Ct
- 17824 Azucar Way
- 18083 Chieftain Ct
- 17728 Creciente Way Unit 16
- 18137 Chieftain Ct
- 17790 Azucar Way
- 18106 Chieftain Ct
- 18114 Chieftain Ct
- 18075 Chieftain Ct
- 18094 Chieftain Ct
- 17768 Alacran Ct