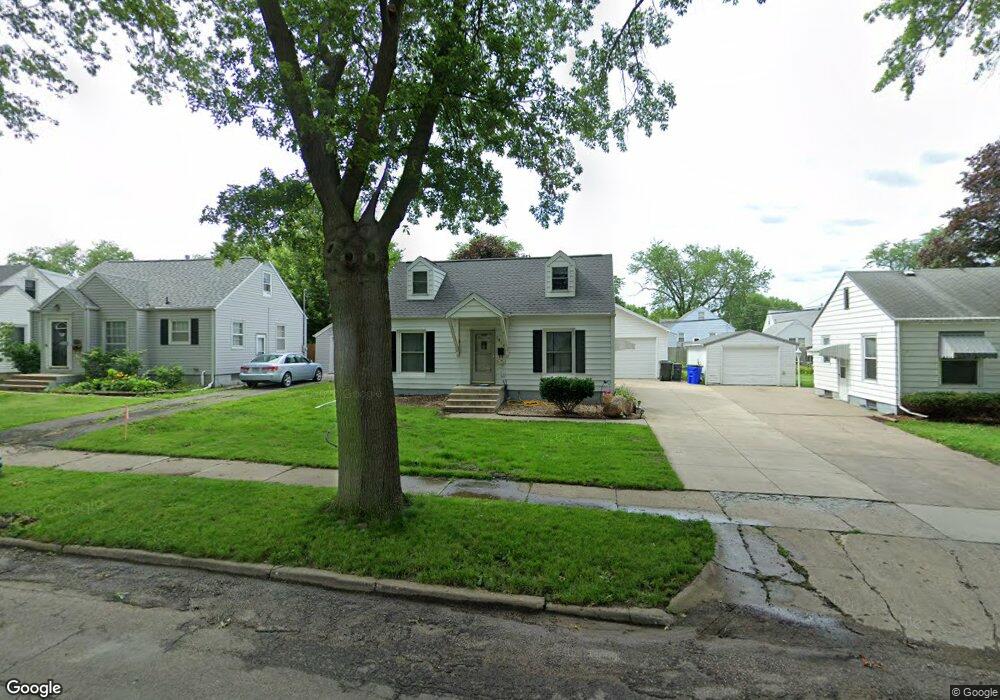
1812 Chandler St SW Cedar Rapids, IA 52404
Cleveland Area NeighborhoodEstimated Value: $159,000 - $170,209
3
Beds
2
Baths
1,116
Sq Ft
$148/Sq Ft
Est. Value
About This Home
This home is located at 1812 Chandler St SW, Cedar Rapids, IA 52404 and is currently estimated at $165,052, approximately $147 per square foot. 1812 Chandler St SW is a home located in Linn County with nearby schools including Junction City Elementary School, Cleveland Elementary School, and Kentucky Tech - Ashland Reg Tech Center.
Ownership History
Date
Name
Owned For
Owner Type
Purchase Details
Closed on
Jun 7, 2007
Sold by
Jp Morgan Chase Bank
Bought by
Thurston Joshua M
Current Estimated Value
Home Financials for this Owner
Home Financials are based on the most recent Mortgage that was taken out on this home.
Original Mortgage
$77,450
Outstanding Balance
$47,417
Interest Rate
6.2%
Mortgage Type
VA
Estimated Equity
$117,635
Purchase Details
Closed on
Mar 6, 2007
Sold by
Morris Jeremiah A and Morris Jamee M
Bought by
Jp Morgan Chase Bank and Equity One Abs Inc Mortgage Pass Through
Purchase Details
Closed on
Apr 14, 2001
Sold by
Matus William P and Matus Janet L
Bought by
Morris Jeremiah A and Morris Jamee M
Home Financials for this Owner
Home Financials are based on the most recent Mortgage that was taken out on this home.
Original Mortgage
$83,905
Interest Rate
7.05%
Create a Home Valuation Report for This Property
The Home Valuation Report is an in-depth analysis detailing your home's value as well as a comparison with similar homes in the area
Home Values in the Area
Average Home Value in this Area
Purchase History
| Date | Buyer | Sale Price | Title Company |
|---|---|---|---|
| Thurston Joshua M | $91,000 | None Available | |
| Jp Morgan Chase Bank | $87,000 | None Available | |
| Morris Jeremiah A | -- | -- |
Source: Public Records
Mortgage History
| Date | Status | Borrower | Loan Amount |
|---|---|---|---|
| Open | Thurston Joshua M | $77,450 | |
| Previous Owner | Morris Jeremiah A | $83,905 |
Source: Public Records
Tax History Compared to Growth
Tax History
| Year | Tax Paid | Tax Assessment Tax Assessment Total Assessment is a certain percentage of the fair market value that is determined by local assessors to be the total taxable value of land and additions on the property. | Land | Improvement |
|---|---|---|---|---|
| 2025 | $2,078 | $146,200 | $27,600 | $118,600 |
| 2024 | $2,186 | $138,900 | $25,100 | $113,800 |
| 2023 | $2,186 | $136,500 | $25,100 | $111,400 |
| 2022 | $2,028 | $115,900 | $21,300 | $94,600 |
| 2021 | $2,094 | $110,300 | $21,300 | $89,000 |
| 2020 | $2,094 | $106,800 | $20,000 | $86,800 |
| 2019 | $1,856 | $97,900 | $20,000 | $77,900 |
| 2018 | $1,800 | $97,900 | $20,000 | $77,900 |
| 2017 | $1,800 | $95,900 | $20,000 | $75,900 |
| 2016 | $1,919 | $93,600 | $20,000 | $73,600 |
| 2015 | $1,979 | $96,365 | $20,047 | $76,318 |
| 2014 | $1,794 | $99,579 | $20,047 | $79,532 |
| 2013 | $1,818 | $99,579 | $20,047 | $79,532 |
Source: Public Records
Map
Nearby Homes
- 1832 8th Ave SW
- 1807 9th Ave SW
- 1602 1st Ave NW
- 235 Highland Dr NW
- 1649 B Ave NW
- 263 Highland Dr NW
- 2433 8th Ave SW
- 290 Highland Dr NW
- 1253 20th St SW
- 1206 18th St SW
- 1400 7th Ave SW
- 2437 9th Ave SW
- 2178 Chandler St SW
- 1311 Burch Ave NW
- 159 26th St NW
- 312 24th Ave NW
- 1860 E Ave NW
- 232 27th St NW
- 1818 Holly Meadow Ave SW
- 1824 Holly Meadow Ave SW
- 1810 Chandler St SW
- 1814 Chandler St SW
- 1808 Chandler St SW
- 1816 Chandler St SW
- 1815 Williams Blvd SW
- 1811 Williams Blvd SW
- 1817 Williams Blvd SW
- 1809 Williams Blvd SW
- 1819 Williams Blvd SW
- 1806 Chandler St SW
- 1818 Chandler St SW
- 1815 Chandler St SW
- 1817 Chandler St SW
- 1807 Williams Blvd SW
- 1821 Williams Blvd SW
- 1811 Chandler St SW
- 1819 Chandler St SW
- 1822 Chandler St SW
- 1804 Chandler St SW
- 1809 Chandler St SW