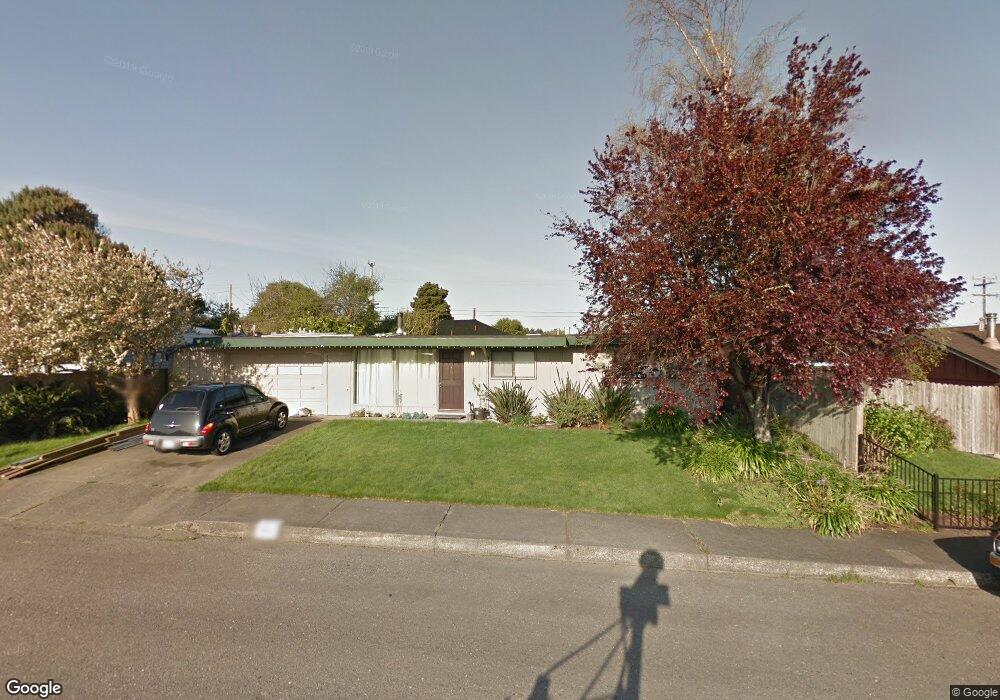
1812 Circle Dr Eureka, CA 95501
Myrtletown NeighborhoodEstimated Value: $386,403 - $435,000
3
Beds
2
Baths
1,340
Sq Ft
$305/Sq Ft
Est. Value
About This Home
This home is located at 1812 Circle Dr, Eureka, CA 95501 and is currently estimated at $409,101, approximately $305 per square foot. 1812 Circle Dr is a home located in Humboldt County with nearby schools including Lafayette Elementary School, Catherine L. Zane Middle School, and Eureka Senior High School.
Ownership History
Date
Name
Owned For
Owner Type
Purchase Details
Closed on
Jul 11, 2006
Sold by
Anderholm Sequoya A and Cross Jeffry T
Bought by
Cross Jeffry T and Anderholm Cross Sequoya A
Current Estimated Value
Home Financials for this Owner
Home Financials are based on the most recent Mortgage that was taken out on this home.
Original Mortgage
$228,000
Outstanding Balance
$183,746
Interest Rate
6.66%
Mortgage Type
New Conventional
Estimated Equity
$225,355
Purchase Details
Closed on
Dec 4, 2002
Sold by
Kennedy Stephen H and Kennedy Susan D
Bought by
Anderholm Sequoya A and Cross Jeffry T
Home Financials for this Owner
Home Financials are based on the most recent Mortgage that was taken out on this home.
Original Mortgage
$116,000
Interest Rate
6.5%
Purchase Details
Closed on
Aug 17, 1999
Sold by
Kennedy Stephen H and Kennedy Susan D
Bought by
Kennedy Stephen H and Kennedy Susan D
Create a Home Valuation Report for This Property
The Home Valuation Report is an in-depth analysis detailing your home's value as well as a comparison with similar homes in the area
Home Values in the Area
Average Home Value in this Area
Purchase History
| Date | Buyer | Sale Price | Title Company |
|---|---|---|---|
| Cross Jeffry T | -- | None Available | |
| Anderholm Sequoya A | $145,000 | Humboldt Land Title Company | |
| Kennedy Stephen H | -- | -- |
Source: Public Records
Mortgage History
| Date | Status | Borrower | Loan Amount |
|---|---|---|---|
| Open | Cross Jeffry T | $228,000 | |
| Previous Owner | Anderholm Sequoya A | $116,000 | |
| Closed | Anderholm Sequoya A | $29,000 |
Source: Public Records
Tax History
| Year | Tax Paid | Tax Assessment Tax Assessment Total Assessment is a certain percentage of the fair market value that is determined by local assessors to be the total taxable value of land and additions on the property. | Land | Improvement |
|---|---|---|---|---|
| 2025 | $2,206 | $209,982 | $82,542 | $127,440 |
| 2024 | $2,206 | $205,866 | $80,924 | $124,942 |
| 2023 | $2,127 | $201,831 | $79,338 | $122,493 |
| 2022 | $2,204 | $197,875 | $77,783 | $120,092 |
| 2021 | $2,067 | $193,996 | $76,258 | $117,738 |
| 2020 | $2,052 | $192,008 | $75,477 | $116,531 |
| 2019 | $2,010 | $188,245 | $73,998 | $114,247 |
| 2018 | $1,979 | $184,555 | $72,548 | $112,007 |
| 2017 | $1,968 | $180,937 | $71,126 | $109,811 |
| 2016 | $1,967 | $177,390 | $69,732 | $107,658 |
| 2015 | $1,949 | $174,726 | $68,685 | $106,041 |
| 2014 | $1,825 | $171,304 | $67,340 | $103,964 |
Source: Public Records
Map
Nearby Homes
- 3219 18th St
- 2364 Ohio St
- 1790 Hill Ave
- 1909 Harrison Ave
- 1852 Dean St
- 3904 Wellington St
- 1408 Mcfarlan St
- 2150 Buhne St
- 3010 Cedar Ln
- 1440 Sunny Ave
- 3274 Montgomery St
- 2305 Harris St
- 2218 Harris St
- 1831 Papke Ct
- 1141 Cousins St
- 3515 Mary Ct
- 2100 Wood St
- 1715 13th St
- 2004 Harris St
- 2437 Bainbridge St
Your Personal Tour Guide
Ask me questions while you tour the home.