Estimated Value: $327,000 - $410,026
3
Beds
2
Baths
1,450
Sq Ft
$268/Sq Ft
Est. Value
About This Home
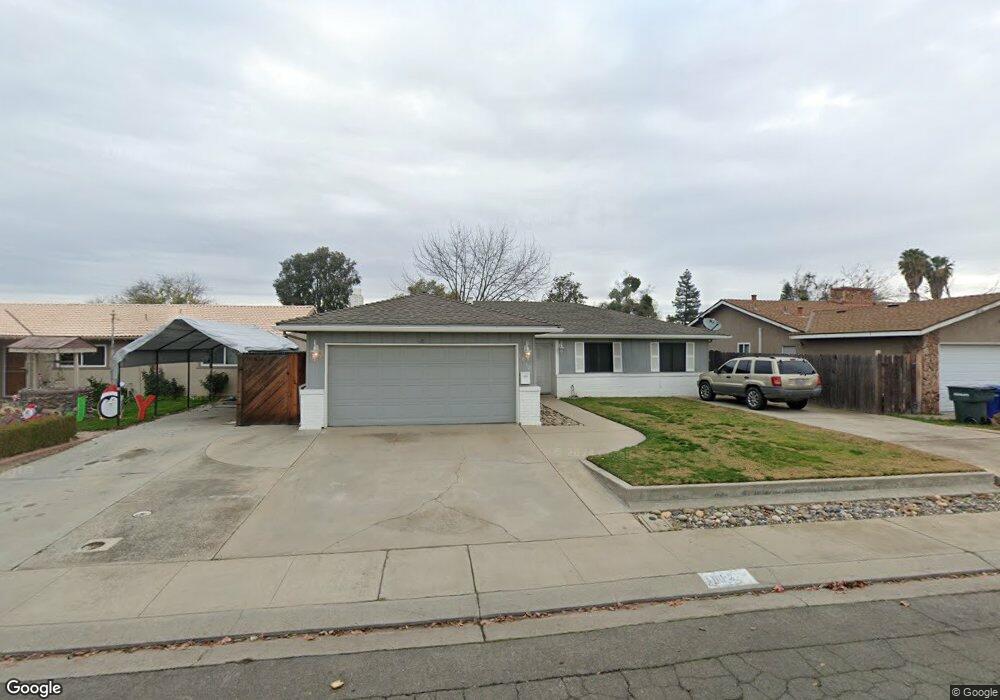
This home is located at 1812 Darwin Ave, Ceres, CA 95307 and is currently estimated at $388,507, approximately $267 per square foot. 1812 Darwin Ave is a home located in Stanislaus County with nearby schools including Carroll Fowler Elementary School, Mae Hensley Junior High School, and Ceres High School.
Ownership History
Date
Name
Owned For
Owner Type
Purchase Details
Closed on
Apr 24, 2009
Sold by
Ingram Sharol
Bought by
Ingram Sharol and Ingram Ricky
Current Estimated Value
Purchase Details
Closed on
Feb 11, 2000
Sold by
Ingram Sharol
Bought by
Ingram Sharol
Home Financials for this Owner
Home Financials are based on the most recent Mortgage that was taken out on this home.
Original Mortgage
$105,204
Outstanding Balance
$34,727
Interest Rate
8.14%
Estimated Equity
$353,780
Purchase Details
Closed on
Sep 17, 1998
Sold by
Ingram Ricky Keith and Ingram Sharol
Bought by
Ingram Sharol
Home Financials for this Owner
Home Financials are based on the most recent Mortgage that was taken out on this home.
Original Mortgage
$10,786
Interest Rate
6.89%
Purchase Details
Closed on
Mar 17, 1997
Sold by
Stroud Raymond W
Bought by
Webb Sharol L
Create a Home Valuation Report for This Property
The Home Valuation Report is an in-depth analysis detailing your home's value as well as a comparison with similar homes in the area
Purchase History
| Date | Buyer | Sale Price | Title Company |
|---|---|---|---|
| Ingram Sharol | -- | None Available | |
| Ingram Sharol | -- | Fidelity National Title | |
| Ingram Sharol | -- | Fidelity National Title | |
| Webb Sharol L | -- | -- |
Source: Public Records
Mortgage History
| Date | Status | Borrower | Loan Amount |
|---|---|---|---|
| Open | Ingram Sharol | $105,204 | |
| Closed | Ingram Sharol | $10,786 |
Source: Public Records
Tax History
| Year | Tax Paid | Tax Assessment Tax Assessment Total Assessment is a certain percentage of the fair market value that is determined by local assessors to be the total taxable value of land and additions on the property. | Land | Improvement |
|---|---|---|---|---|
| 2025 | $773 | $72,706 | $21,798 | $50,908 |
| 2024 | $723 | $71,281 | $21,371 | $49,910 |
| 2023 | $702 | $69,884 | $20,952 | $48,932 |
| 2022 | $695 | $68,515 | $20,542 | $47,973 |
| 2021 | $687 | $67,173 | $20,140 | $47,033 |
| 2020 | $666 | $66,485 | $19,934 | $46,551 |
| 2019 | $660 | $65,183 | $19,544 | $45,639 |
| 2018 | $645 | $63,906 | $19,161 | $44,745 |
| 2017 | $638 | $62,654 | $18,786 | $43,868 |
| 2016 | $624 | $61,426 | $18,418 | $43,008 |
| 2015 | $613 | $60,504 | $18,142 | $42,362 |
| 2014 | $599 | $59,320 | $17,787 | $41,533 |
Source: Public Records
Map
Nearby Homes
- 1821 Rose Ave
- 2841 Fowler Rd Unit 33
- 2644 Parkway
- 1954 Robin Dr
- 1655 Moffett Rd
- 1647 Moffett Rd
- 1645 Moffett Rd
- 3009 Glen Grove Ct
- 2605 Glasgow Dr
- 1617 Charlottesville Ln
- 2845 E Hatch Rd Unit 78
- 2845 E Hatch Rd Unit 86
- 2845 E Hatch Rd Unit 84
- 2409 Lavon Ln
- 1813 Lupin Ln
- 1821 Myrtlewood Dr
- 2511 E Hatch Rd
- 2509 E Hatch Rd
- 2313 Thomas St
- 1415 Villa Way
- 1808 Darwin Ave
- 1816 Darwin Ave
- 1813 Rose Ave
- 1809 Rose Ave
- 1804 Darwin Ave
- 1817 Rose Ave
- 1820 Darwin Ave
- 1813 Darwin Ave
- 1805 Rose Ave
- 1809 Darwin Ave
- 1817 Darwin Ave
- 1800 Darwin Ave
- 1805 Darwin Ave
- 1821 Darwin Ave
- 1801 Rose Ave
- 1825 Rose Ave
- 1801 Darwin Ave
- 1748 Darwin Ave
- 1749 Rose Ave
- 2733 Fowler Rd
Your Personal Tour Guide
Ask me questions while you tour the home.