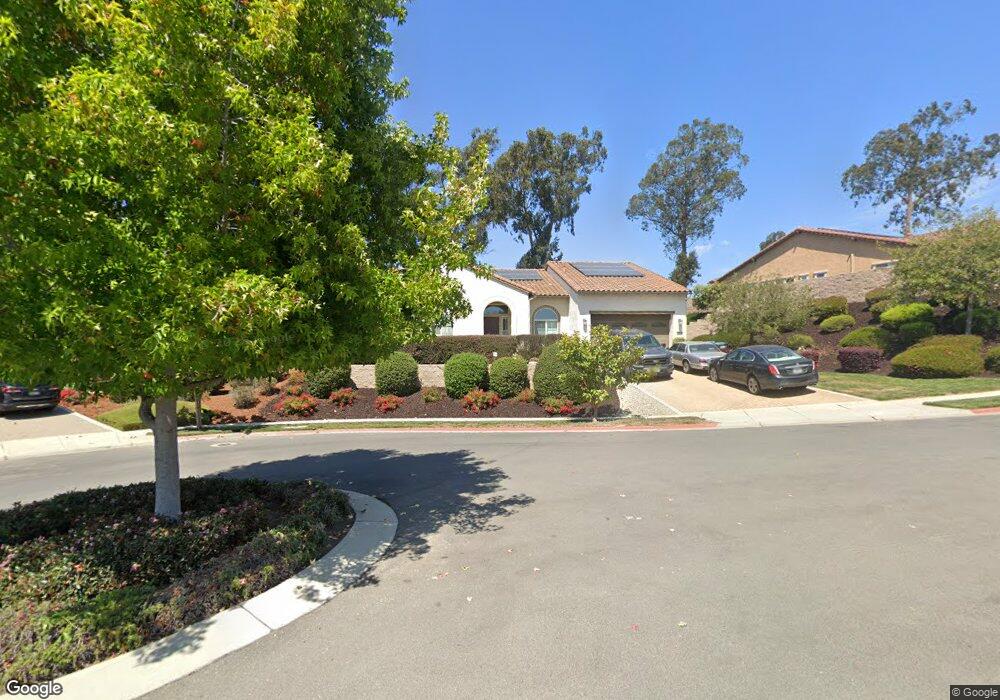
1812 Louise Ln Nipomo, CA 93444
Woodlands NeighborhoodEstimated Value: $1,647,000 - $1,751,000
3
Beds
4
Baths
3,195
Sq Ft
$537/Sq Ft
Est. Value
About This Home
This home is located at 1812 Louise Ln, Nipomo, CA 93444 and is currently estimated at $1,714,723, approximately $536 per square foot. 1812 Louise Ln is a home located in San Luis Obispo County with nearby schools including Dorothea Lange Elementary School, Mesa Middle School, and Nipomo High School.
Ownership History
Date
Name
Owned For
Owner Type
Purchase Details
Closed on
Dec 23, 2015
Sold by
Shea Homes Limited Partnership
Bought by
Cullen Edward F and Cullen Phyllis
Current Estimated Value
Purchase Details
Closed on
Dec 21, 2013
Sold by
Monarch Dunes Llc
Bought by
Shea Homes Limited Partnership
Purchase Details
Closed on
Jan 22, 2013
Sold by
Par Woodlands Custom Development Llc
Bought by
Monarch Dunes Llc
Purchase Details
Closed on
Aug 12, 2008
Sold by
Woodlands Ventures Llc
Bought by
Par Woodlands Custom Development Llc
Home Financials for this Owner
Home Financials are based on the most recent Mortgage that was taken out on this home.
Original Mortgage
$1,987,000
Interest Rate
6.37%
Mortgage Type
Purchase Money Mortgage
Create a Home Valuation Report for This Property
The Home Valuation Report is an in-depth analysis detailing your home's value as well as a comparison with similar homes in the area
Home Values in the Area
Average Home Value in this Area
Purchase History
| Date | Buyer | Sale Price | Title Company |
|---|---|---|---|
| Cullen Edward F | $915,000 | First American Title Company | |
| Shea Homes Limited Partnership | -- | First American Title Company | |
| Monarch Dunes Llc | -- | First American Title Company | |
| Par Woodlands Custom Development Llc | $1,870,000 | First American Title Company |
Source: Public Records
Mortgage History
| Date | Status | Borrower | Loan Amount |
|---|---|---|---|
| Previous Owner | Par Woodlands Custom Development Llc | $1,987,000 |
Source: Public Records
Tax History Compared to Growth
Tax History
| Year | Tax Paid | Tax Assessment Tax Assessment Total Assessment is a certain percentage of the fair market value that is determined by local assessors to be the total taxable value of land and additions on the property. | Land | Improvement |
|---|---|---|---|---|
| 2025 | $11,140 | $1,083,046 | $503,109 | $579,937 |
| 2024 | $11,012 | $1,061,811 | $493,245 | $568,566 |
| 2023 | $11,012 | $1,040,992 | $483,574 | $557,418 |
| 2022 | $10,846 | $1,020,582 | $474,093 | $546,489 |
| 2021 | $10,826 | $1,000,572 | $464,798 | $535,774 |
| 2020 | $10,703 | $990,314 | $460,033 | $530,281 |
| 2019 | $10,637 | $970,897 | $451,013 | $519,884 |
| 2018 | $10,510 | $951,861 | $442,170 | $509,691 |
| 2017 | $10,314 | $933,198 | $433,500 | $499,698 |
| 2016 | $7,698 | $724,008 | $234,108 | $489,900 |
| 2015 | $2,139 | $201,043 | $201,043 | $0 |
| 2014 | $2,060 | $197,105 | $197,105 | $0 |
Source: Public Records
Map
Nearby Homes
- 867 Trail View Place
- 1849 Eucalyptus Rd
- 1156 Spring Azure Way
- 1187 Swallowtail Way
- 1153 Spring Azure Way
- 1685 Louise Ln
- 1783 Trilogy Pkwy
- 1245 Justin Ln
- 1160 Korey Ct
- 1520 California 1
- 981 Trail View Place
- 1147 Vaquero Way
- 1539 Vista Tesoro Place
- 1175 Danielle Ct
- 977 Jacqueline Place
- 961 Jacqueline Place
- 1455 Via Vista
- 1441 Via Vista
- 1441 Vicki Ln
- 1195 Trail View Place
- 1804 Louise Ln
- 1820 Louise Ln
- 1828 Louise Ln
- 1796 Louise Ln
- 1817 Louise Ln
- 1825 Louise Ln
- 1788 Louise Ln
- 1793 Louise Ln
- 1780 Louise Ln
- 1783 Louise Ln
- 1772 Louise Ln
- 1775 Louise Ln
- 1764 Louise Ln
- 848 Trail View Place
- 1803 Tomas Ct
- 1767 Louise Ln
- 852 Trail View Place
- 1225 Proffessional Pkwy
- 843 Trail View Place