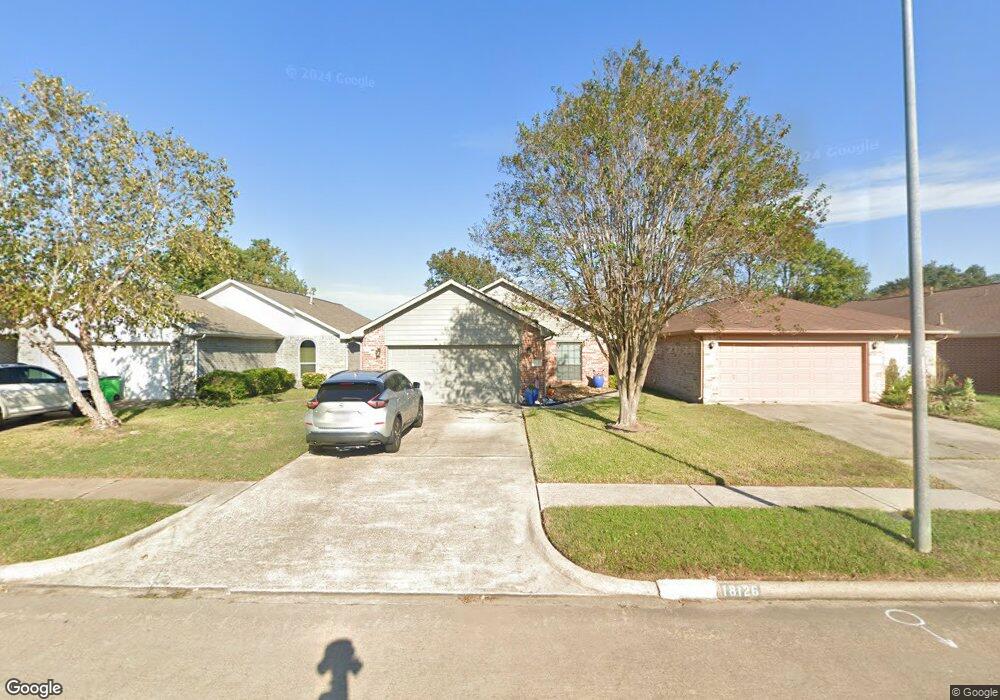
18126 Beaverdell Dr Tomball, TX 77377
Northpointe NeighborhoodEstimated Value: $237,409 - $247,000
3
Beds
2
Baths
1,331
Sq Ft
$182/Sq Ft
Est. Value
About This Home
This home is located at 18126 Beaverdell Dr, Tomball, TX 77377 and is currently estimated at $242,852, approximately $182 per square foot. 18126 Beaverdell Dr is a home located in Harris County with nearby schools including Willow Creek Elementary School, Willow Wood Junior High School, and Northpointe Intermediate School.
Ownership History
Date
Name
Owned For
Owner Type
Purchase Details
Closed on
Aug 8, 2001
Sold by
Hess Justin J and Hess Lizabeth Reilly
Bought by
Burdick Richard and Burdick Patricia
Current Estimated Value
Home Financials for this Owner
Home Financials are based on the most recent Mortgage that was taken out on this home.
Original Mortgage
$88,600
Outstanding Balance
$34,362
Interest Rate
7.07%
Mortgage Type
FHA
Estimated Equity
$208,490
Purchase Details
Closed on
Jan 25, 2001
Sold by
Blake Jeffrey and Blake Julie
Bought by
Hess Justin J and Hess Lizabeth Reilly
Home Financials for this Owner
Home Financials are based on the most recent Mortgage that was taken out on this home.
Original Mortgage
$83,391
Interest Rate
7.43%
Mortgage Type
FHA
Purchase Details
Closed on
Aug 31, 1998
Sold by
Jmc Homes Inc
Bought by
Blake Jeffrey and Blake Julie
Home Financials for this Owner
Home Financials are based on the most recent Mortgage that was taken out on this home.
Original Mortgage
$70,757
Interest Rate
6.95%
Mortgage Type
Purchase Money Mortgage
Create a Home Valuation Report for This Property
The Home Valuation Report is an in-depth analysis detailing your home's value as well as a comparison with similar homes in the area
Home Values in the Area
Average Home Value in this Area
Purchase History
| Date | Buyer | Sale Price | Title Company |
|---|---|---|---|
| Burdick Richard | -- | Charter Title Company | |
| Hess Justin J | -- | Charter Title Company | |
| Blake Jeffrey | -- | Stewart Title |
Source: Public Records
Mortgage History
| Date | Status | Borrower | Loan Amount |
|---|---|---|---|
| Open | Burdick Richard | $88,600 | |
| Previous Owner | Hess Justin J | $83,391 | |
| Previous Owner | Blake Jeffrey | $70,757 |
Source: Public Records
Tax History Compared to Growth
Tax History
| Year | Tax Paid | Tax Assessment Tax Assessment Total Assessment is a certain percentage of the fair market value that is determined by local assessors to be the total taxable value of land and additions on the property. | Land | Improvement |
|---|---|---|---|---|
| 2025 | $4,126 | $307,822 | $40,126 | $267,696 |
| 2024 | $4,126 | $260,722 | $40,126 | $220,596 |
| 2023 | $4,126 | $275,198 | $40,126 | $235,072 |
| 2022 | $5,030 | $234,041 | $33,732 | $200,309 |
| 2021 | $4,722 | $183,280 | $30,866 | $152,414 |
| 2020 | $4,560 | $176,744 | $24,252 | $152,492 |
| 2019 | $4,230 | $153,882 | $20,945 | $132,937 |
| 2018 | $1,546 | $142,745 | $15,874 | $126,871 |
| 2017 | $3,578 | $134,829 | $15,874 | $118,955 |
| 2016 | $3,252 | $128,420 | $15,874 | $112,546 |
| 2015 | $2,494 | $122,706 | $15,874 | $106,832 |
| 2014 | $2,494 | $105,047 | $15,874 | $89,173 |
Source: Public Records
Map
Nearby Homes
- 12046 Westlock Dr
- 12007 Northpointe Meadows Dr
- 11934 Westwold Dr
- 12107 Westwold Dr
- 11902 Oakner Dr
- 11922 Westwold Dr
- 11831 Westlock Dr
- 12242 Westlock Dr
- 12226 Westwold Dr
- 12331 Westwold Dr
- 18135 Gravenhurst Ln
- 12022 Canyon Star Ln
- 18314 Westlock St
- 12222 Brighton Brook Ln
- 17814 Winkler Willow Ct
- 12006 Canyon Star Ln
- 19010 Canyon Star Ct
- 18703 Summercliff Ln
- 12414 Montebello Manor Ln
- 18814 Emery Meadows Ln
- 18122 Beaverdell Dr
- 18130 Beaverdell Dr
- 18118 Beaverdell Dr
- 18134 Beaverdell Dr
- 12026 Oakner Dr
- 18202 Beaverdell Dr
- 18114 Beaverdell Dr
- 12022 Oakner Dr
- 18206 Beaverdell Dr
- 18127 Beaverdell Dr
- 18131 Beaverdell Dr
- 18123 Beaverdell Dr
- 12018 Oakner Dr
- 18135 Beaverdell Dr
- 18119 Beaverdell Dr
- 18210 Beaverdell Dr
- 18203 Beaverdell Dr
- 18115 Beaverdell Dr
- 12014 Oakner Dr
- 18207 Beaverdell Dr