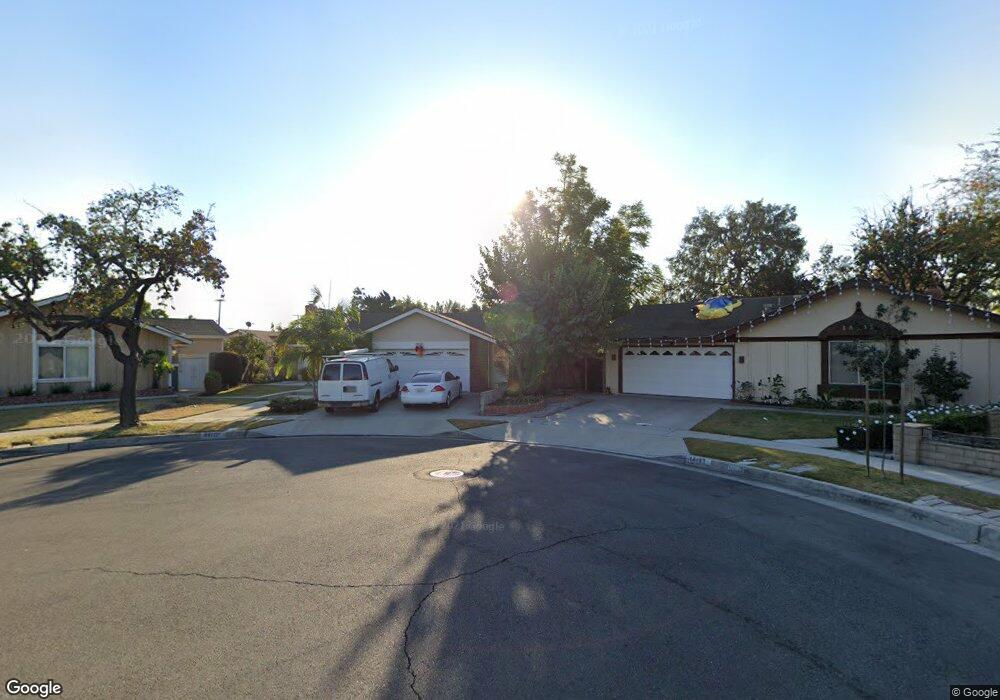
18128 Parkvalle Cir Cerritos, CA 90703
Estimated Value: $1,175,000 - $1,230,000
4
Beds
2
Baths
1,428
Sq Ft
$836/Sq Ft
Est. Value
About This Home
This home is located at 18128 Parkvalle Cir, Cerritos, CA 90703 and is currently estimated at $1,194,382, approximately $836 per square foot. 18128 Parkvalle Cir is a home located in Los Angeles County with nearby schools including Cerritos Elementary School, Carmenita Middle School, and Cerritos High School.
Ownership History
Date
Name
Owned For
Owner Type
Purchase Details
Closed on
Jan 23, 2017
Sold by
Bae An Soon
Bought by
Jung Ok Hee
Current Estimated Value
Home Financials for this Owner
Home Financials are based on the most recent Mortgage that was taken out on this home.
Original Mortgage
$190,000
Outstanding Balance
$156,577
Interest Rate
4.12%
Mortgage Type
New Conventional
Estimated Equity
$1,037,805
Purchase Details
Closed on
Jun 13, 2008
Sold by
Ortega Jose Luis
Bought by
Bae An Soon
Purchase Details
Closed on
Aug 21, 2006
Sold by
Linton Paul J and Linton Sondra K
Bought by
Ortega Jose Luis
Home Financials for this Owner
Home Financials are based on the most recent Mortgage that was taken out on this home.
Original Mortgage
$544,000
Interest Rate
7.5%
Mortgage Type
Purchase Money Mortgage
Create a Home Valuation Report for This Property
The Home Valuation Report is an in-depth analysis detailing your home's value as well as a comparison with similar homes in the area
Home Values in the Area
Average Home Value in this Area
Purchase History
| Date | Buyer | Sale Price | Title Company |
|---|---|---|---|
| Jung Ok Hee | $550,000 | Wfg National Title Company | |
| Bae An Soon | -- | Wfg National Title Company | |
| Bae An Soon | $549,000 | First Southwestern Title | |
| Ortega Jose Luis | $680,000 | Chicago Title Co |
Source: Public Records
Mortgage History
| Date | Status | Borrower | Loan Amount |
|---|---|---|---|
| Open | Jung Ok Hee | $190,000 | |
| Previous Owner | Ortega Jose Luis | $544,000 |
Source: Public Records
Tax History Compared to Growth
Tax History
| Year | Tax Paid | Tax Assessment Tax Assessment Total Assessment is a certain percentage of the fair market value that is determined by local assessors to be the total taxable value of land and additions on the property. | Land | Improvement |
|---|---|---|---|---|
| 2025 | $9,447 | $806,602 | $644,122 | $162,480 |
| 2024 | $9,447 | $790,788 | $631,493 | $159,295 |
| 2023 | $9,133 | $775,283 | $619,111 | $156,172 |
| 2022 | $8,995 | $760,082 | $606,972 | $153,110 |
| 2021 | $8,785 | $745,179 | $595,071 | $150,108 |
| 2019 | $8,580 | $723,078 | $577,422 | $145,656 |
| 2018 | $7,961 | $708,900 | $566,100 | $142,800 |
| 2016 | $6,684 | $584,747 | $416,091 | $168,656 |
| 2015 | $6,600 | $575,964 | $409,841 | $166,123 |
| 2014 | $6,467 | $564,682 | $401,813 | $162,869 |
Source: Public Records
Map
Nearby Homes
- 18517 Betty Way
- 7152 Caprice Cir
- 13210 Sutton St
- 5412 Bransford Dr
- 19118 Martha Ave
- 18006 Point Conception Place
- 13044 Hedda Ln
- 13370 Holly Oak Cir
- 5836 Trinidad Way
- 5568 Ozawa Cir
- 5686 Panama Dr
- 19008 Jeffrey Ave
- 13010 Artesia Blvd
- 6861 Frost Cir
- 7571 San Rafael Dr
- 13548 Village Dr Unit A
- 5072 Alder Ln
- 12711 Castleford Ln
- 12967 Moorshire Dr
- 5212 Lena Dr
- 18124 Parkvalle Cir
- 18133 Parkvalle Cir
- 18131 Antonio Ave
- 18125 Antonio Ave
- 18118 Parkvalle Cir
- 18129 Parkvalle Cir
- 18119 Antonio Ave
- 18135 Antonio Ave
- 18125 Parkvalle Cir
- 13735 La Jara Cir
- 18112 Parkvalle Cir
- 13739 La Jara Cir
- 18119 Parkvalle Cir
- 18303 Parkvalle Ave
- 18115 Antonio Ave
- 13745 La Jara Cir
- 18113 Parkvalle Cir
- 18108 Parkvalle Cir
- 18130 Antonio Ave
- 18309 Parkvalle Ave