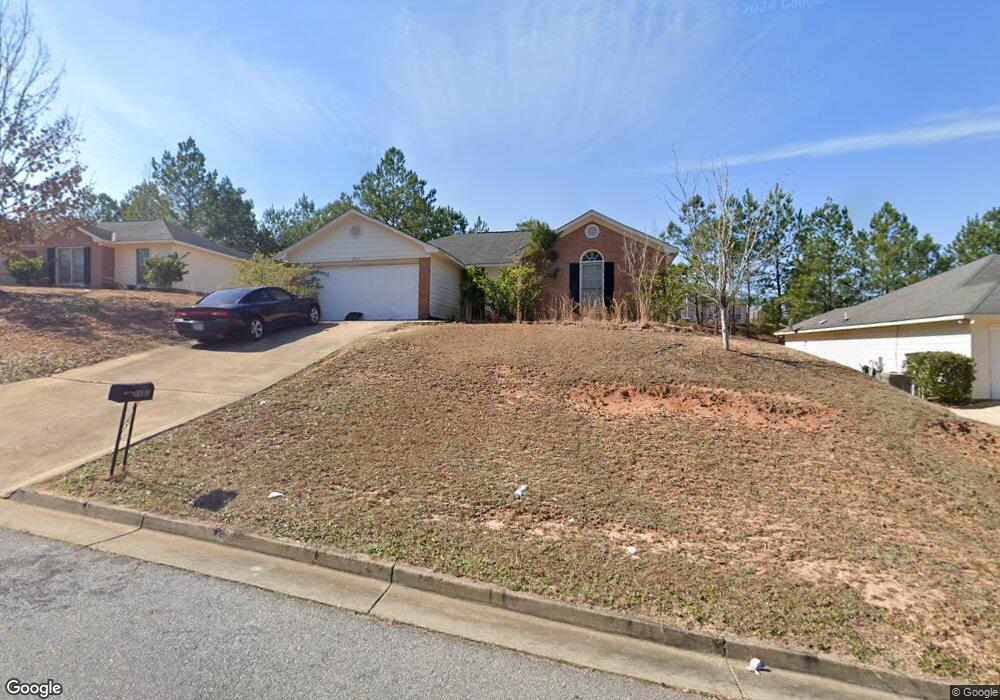
1813 Cumbaa Ct Columbus, GA 31907
Eastern Columbus NeighborhoodEstimated Value: $132,000 - $183,000
4
Beds
3
Baths
1,257
Sq Ft
$126/Sq Ft
Est. Value
About This Home
This home is located at 1813 Cumbaa Ct, Columbus, GA 31907 and is currently estimated at $158,206, approximately $125 per square foot. 1813 Cumbaa Ct is a home located in Muscogee County with nearby schools including Wesley Heights Elementary School, Fort Middle School, and Kendrick High School.
Ownership History
Date
Name
Owned For
Owner Type
Purchase Details
Closed on
Jan 16, 2019
Sold by
S & K Strategic Investments Llc
Bought by
Dasilva Yolanda Giovanna
Current Estimated Value
Home Financials for this Owner
Home Financials are based on the most recent Mortgage that was taken out on this home.
Original Mortgage
$66,800
Outstanding Balance
$58,731
Interest Rate
4.6%
Mortgage Type
New Conventional
Estimated Equity
$99,475
Purchase Details
Closed on
Nov 29, 2014
Sold by
Keller Bradford T
Bought by
S & K Strategic Investments Llc
Purchase Details
Closed on
Oct 28, 2014
Sold by
Santorum Daniel J
Bought by
Keller Bradford T and Smith Steohen T
Purchase Details
Closed on
Jun 7, 2013
Sold by
Santorum Catherine D
Bought by
Santorum Catherine D and Santorum Danie
Purchase Details
Closed on
Feb 5, 2013
Sold by
Santorum Catherine D
Bought by
Santorum Daniel J and Santorum Melissa S
Create a Home Valuation Report for This Property
The Home Valuation Report is an in-depth analysis detailing your home's value as well as a comparison with similar homes in the area
Home Values in the Area
Average Home Value in this Area
Purchase History
| Date | Buyer | Sale Price | Title Company |
|---|---|---|---|
| Dasilva Yolanda Giovanna | $83,500 | -- | |
| S & K Strategic Investments Llc | -- | -- | |
| Keller Bradford T | $57,000 | -- | |
| Santorum Catherine D | -- | -- | |
| Santorum Daniel J | -- | -- | |
| Santorum Catherine D | -- | -- |
Source: Public Records
Mortgage History
| Date | Status | Borrower | Loan Amount |
|---|---|---|---|
| Open | Dasilva Yolanda Giovanna | $66,800 |
Source: Public Records
Tax History Compared to Growth
Tax History
| Year | Tax Paid | Tax Assessment Tax Assessment Total Assessment is a certain percentage of the fair market value that is determined by local assessors to be the total taxable value of land and additions on the property. | Land | Improvement |
|---|---|---|---|---|
| 2025 | $2,067 | $52,804 | $10,528 | $42,276 |
| 2024 | $2,067 | $52,804 | $10,528 | $42,276 |
| 2023 | $21 | $52,804 | $10,528 | $42,276 |
| 2022 | $1,861 | $45,572 | $10,528 | $35,044 |
| 2021 | $1,312 | $32,132 | $10,528 | $21,604 |
| 2020 | $1,364 | $33,400 | $11,200 | $22,200 |
| 2019 | $1,542 | $37,632 | $12,632 | $25,000 |
| 2018 | $1,542 | $37,632 | $12,632 | $25,000 |
| 2017 | $1,547 | $37,632 | $12,632 | $25,000 |
| 2016 | $1,226 | $29,730 | $9,600 | $20,130 |
| 2015 | $377 | $22,800 | $9,600 | $13,200 |
| 2014 | $806 | $48,758 | $9,600 | $39,158 |
| 2013 | -- | $48,758 | $9,600 | $39,158 |
Source: Public Records
Map
Nearby Homes
- 5833 Gleneden Dr
- 5920 Gleneden Dr
- 5929 Gleneden Dr
- 2525 Corineth Dr
- 2807 Doyle Ave
- 6059 Nassau Cir
- 5906 Forrest Rd
- 2672 Honeysuckle Dr
- 6028 Caribou Dr
- 2940 Urban Ave
- 6000 Caribou Dr
- 2501 White Chapel Dr
- 2505 White Chapel Dr
- 3027 Lansing Ave
- 6032 Cordova Rd
- 2249 Mahan Dr
- 6213 Fitzgerald Dr
- 5759 Forrest Rd
- 6916 Bradshaw Dr
- 3301 Musket Dr
- 1809 Cumbaa Ct
- 1817 Cumbaa Ct
- 5798 Glenmere Dr
- 5786 Glenmere Dr
- 1805 Cumbaa Ct
- 5780 Glenmere Dr
- 1812 Cumbaa Ct
- 1816 Cumbaa Ct
- 1808 Cumbaa Ct
- 5774 Glenmere Dr
- 1804 Cumbaa Ct
- 1801 Cumbaa Ct
- 0 Glenmere Dr Unit 7370065
- 0 Glenmere Dr Unit 7184239
- 0 Glenmere Dr Unit 7339238
- 0 Glenmere Dr
- 5823 Glenmere Dr
- 5805 Glenmere Dr
- 5811 Glenmere Dr
- 5768 Glenmere Dr