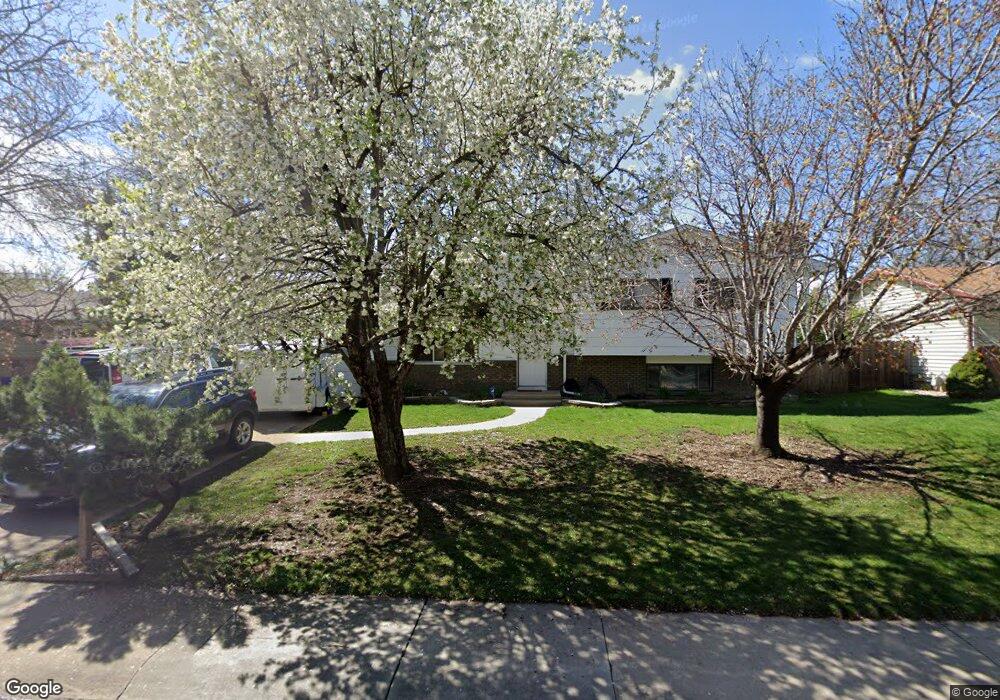
1813 Valley Forge Ave Fort Collins, CO 80526
Estimated Value: $520,556 - $574,000
3
Beds
4
Baths
1,678
Sq Ft
$326/Sq Ft
Est. Value
About This Home
This home is located at 1813 Valley Forge Ave, Fort Collins, CO 80526 and is currently estimated at $547,139, approximately $326 per square foot. 1813 Valley Forge Ave is a home located in Larimer County with nearby schools including Bennett Elementary School, Blevins Middle School, and Rocky Mountain High School.
Ownership History
Date
Name
Owned For
Owner Type
Purchase Details
Closed on
Jul 3, 2007
Sold by
Been Lynda L and Been Johan H
Bought by
Hurd Justin T and Olander Erin E
Current Estimated Value
Home Financials for this Owner
Home Financials are based on the most recent Mortgage that was taken out on this home.
Original Mortgage
$167,120
Outstanding Balance
$103,963
Interest Rate
6.41%
Mortgage Type
New Conventional
Estimated Equity
$443,176
Purchase Details
Closed on
Feb 9, 2005
Sold by
Been Lynda
Bought by
Been Johan H and Been Lynda L
Purchase Details
Closed on
Oct 18, 2002
Sold by
Green William L and Green Doris J
Bought by
Been Lynda
Home Financials for this Owner
Home Financials are based on the most recent Mortgage that was taken out on this home.
Original Mortgage
$184,000
Interest Rate
6%
Purchase Details
Closed on
Nov 1, 1972
Bought by
Green William L and Green Doris J
Create a Home Valuation Report for This Property
The Home Valuation Report is an in-depth analysis detailing your home's value as well as a comparison with similar homes in the area
Home Values in the Area
Average Home Value in this Area
Purchase History
| Date | Buyer | Sale Price | Title Company |
|---|---|---|---|
| Hurd Justin T | $208,900 | None Available | |
| Been Johan H | -- | -- | |
| Been Lynda | $209,900 | -- | |
| Green William L | -- | -- |
Source: Public Records
Mortgage History
| Date | Status | Borrower | Loan Amount |
|---|---|---|---|
| Open | Hurd Justin T | $167,120 | |
| Previous Owner | Been Lynda | $184,000 |
Source: Public Records
Tax History Compared to Growth
Tax History
| Year | Tax Paid | Tax Assessment Tax Assessment Total Assessment is a certain percentage of the fair market value that is determined by local assessors to be the total taxable value of land and additions on the property. | Land | Improvement |
|---|---|---|---|---|
| 2025 | $2,935 | $34,271 | $3,015 | $31,256 |
| 2024 | $2,792 | $34,271 | $3,015 | $31,256 |
| 2022 | $2,301 | $24,367 | $3,128 | $21,239 |
| 2021 | $2,325 | $25,068 | $3,218 | $21,850 |
| 2020 | $2,264 | $24,196 | $3,218 | $20,978 |
| 2019 | $2,274 | $24,196 | $3,218 | $20,978 |
| 2018 | $2,025 | $22,219 | $3,240 | $18,979 |
| 2017 | $2,018 | $22,219 | $3,240 | $18,979 |
| 2016 | $1,738 | $19,040 | $3,582 | $15,458 |
| 2015 | $1,726 | $19,040 | $3,580 | $15,460 |
| 2014 | $1,605 | $17,590 | $3,580 | $14,010 |
Source: Public Records
Map
Nearby Homes
- 2404 Sheffield Cir E
- 2420 Sheffield Cir E
- 1757 Concord Dr
- 1905 Yorktown Ave
- 2613 Hanover Dr
- 2109 W Drake Rd
- 2206 Rambouillet Dr
- 1701 Glenwood Dr
- 2607 S Taft Hill Rd
- 2114 Water Blossom Ln
- 2800 S Taft Hill Rd
- 1513 Independence Rd
- 2706 Dunbar Ave
- 1419 Glen Haven Dr
- 2718 Dunbar Ave
- 1955 Kingsborough Dr
- 2738 Bradford Square
- 1854 Marlborough Ct
- 2855 Trenton Way
- 2828 Silverplume Dr
- 1819 Valley Forge Ave
- 1807 Valley Forge Ave
- 1732 Concord Dr
- 1728 Concord Dr
- 1801 Valley Forge Ave
- 2400 Sheffield Cir E
- 1812 Valley Forge Ave
- 1806 Valley Forge Ave
- 1818 Valley Forge Ave
- 1724 Concord Dr
- 1729 Concord Dr
- 2408 Sheffield Cir E
- 1800 Valley Forge Ave
- 1731 Valley Forge Ave
- 1824 Valley Forge Ave
- 1736 Valley Forge Ave
- 1720 Concord Dr
- 2412 Sheffield Cir E
- 1725 Concord Dr
- 1825 Scarborough Dr